
Data & Analytics ROI, Part Three: Three Initiatives, One Year

Abdul Fahad Noori
September 23, 2026

Abstract: This article examines three bank-wide initiatives with varying ROI outcomes, showing how lifecycle stage, budget overruns, and schedule delays affect project performance. It highlights how leaders can uncover hidden costs and identify underperforming initiatives that may be overlooked at the portfolio level.
Read time: 17 mins.
You’ll learn:
How three initiatives inside one bank were tracked for a full year, ending at three different lifecycle stages: Graduated, Underperforming, and Negative ROI
Why a strong ROI and a budget overrun can coexist in the same initiative, and how "underperforming" and "positive ROI" can both be true at once
A missed deadline's two separate costs: the extra money already spent reacting to it, and the return that should have been earned by now but wasn't
How a blended ROI number answers whether your overall data and analytics spending is worth it, even when individual initiatives are struggling
How to start tracking an initiative that's already deployed, using only records you can verify
Getting a budget approved for a new analytics initiative is hard enough on its own. Every proposal competes against a dozen others. Finance asks for a business case before committing a dollar, and even a strong pitch can sit for months waiting on the next planning cycle. Leaders who clear that bar assume the hard part is behind them.
Budgets get revisited every time the business tightens its belt, and revisiting means every initiative must justify itself again, this time with results instead of a proposal. An initiative that's working can still get cut in a budget crunch, because no one in the room can prove it should keep going. Ask the team behind it, and they'll have an answer. It won't be a number. It'll be a feeling, a few grateful comments, maybe a chart trending up with no baseline behind it.
Without a number, funding decisions become a matter of trust and momentum. An initiative that's quietly failing keeps getting renewed because no one can prove it should stop. Everyone in the room is guessing, and the guessing gets treated like a decision.
Meridian Regional Bank doesn't guess. It tracks the ROI of three analytics initiatives running in parallel, each at a different point in its lifecycle.
Initiative A already crossed its goal and returned 719% on every dollar invested. Initiative B hasn't reached its goal yet — it's underperforming, but its ROI is still positive at 210%. Initiative C just hit its deadline at −38.7%; the finish line arriving before the value did.
Do You Need to Track ROI From Launch?
Part Two explains the ROI formula and its components, regardless of whether your initiative has been deployed yet. This article applies those components to real, ongoing data, using Meridian's three initiatives to walk through exactly how the numbers get compiled and calculated.
If your initiative hasn't been deployed yet, this article will still apply once it has. If it's already running, sometimes months already, there's one difference worth addressing directly: you can't wait for future data to fill in a past you didn't track. Start now and work backward with whatever records you can verify.
A worked example: say you're eight months in and no ledger exists yet.
|
Period |
Amount |
Where it came from |
|
March 2026 |
$340,000 |
Finance's Q1 close report |
|
June 2026 |
$410,000 |
Quarterly business review deck |
|
April, May 2026 |
N/A |
No verifiable record |
Two verified periods are enough to compute a real ROI as of your latest confirmed date. That's not the full picture, but it's an honest one, and an honest partial number beats a guessed complete one every time you're the one signing off on it.
Meridian Regional Bank
To show how the ROI framework works, we use an illustrative example: Meridian Regional Bank. It's a mid-size regional bank serving retail and commercial customers. It competes against both larger national banks and digital-only entrants. An internal review found the bank had no consistent way to compare returns across its analytics investments, which made it hard to know what to fund and what to cut. Leadership commissioned a portfolio of three initiatives to fix that, one for each of the bank's main value levers: growing revenue, avoiding losses, and reducing operating cost. Each had an internal sponsor willing to commit budget once the projected ROI case cleared finance.
Initiative A: Next Best Offer Analytics (the revenue lever)
The problem: Retail margins had compressed as digital-only competitors pulled wallet share with more relevant offers, and Meridian's own cross-sell offers were still built on branch staff instinct rather than customer data.
The solution: a next-best-offer engine that ranks products by transaction history and existing relationships, surfaced to staff in real time, sponsored by the Retail Marketing VP after a limited, single-product-line pilot showed a measurable lift.
The goal: $8,000,000 in additional annual gross profit, credited to Meridian's overall P&L, against an annual cross-sell baseline of $48,000,000.
Data Sources
Every number in Initiative A's ledger traces back to one place: a checkpoint row in Data Sources, logged by Priya Shah on the growth analytics squad. Most months, the entry is the same: a CRM export, pulled directly from the cross-sell attribution report, rated High accuracy. Fourteen checkpoints span thirteen elapsed months, March 2025 through March 2026. May 2025 alone carries two entries, the regular monthly checkpoint and the mid-month delay entry. The last checkpoint, March 2026, is the month the initiative crossed its full-year goal.
Not every checkpoint looks like that. In May 2025, checkpoint 4 has no Actual $ figure at all, just a note pointing to Value & Cost Tracker for what happened during that period: a delay, not a missing entry. Checkpoint 6, mid-CRM-migration, has a Medium accuracy rating because the figure was computed manually from raw transaction data as a one-off substitute. Checkpoint 10 was prepared by David Osei in FP&A instead of Priya, cross-checked against Finance's month-end close rather than the CRM export.
That’s the record working as intended: when the primary source is unavailable or unreliable, the ledger says so, names who filled the gap and how, and moves on. 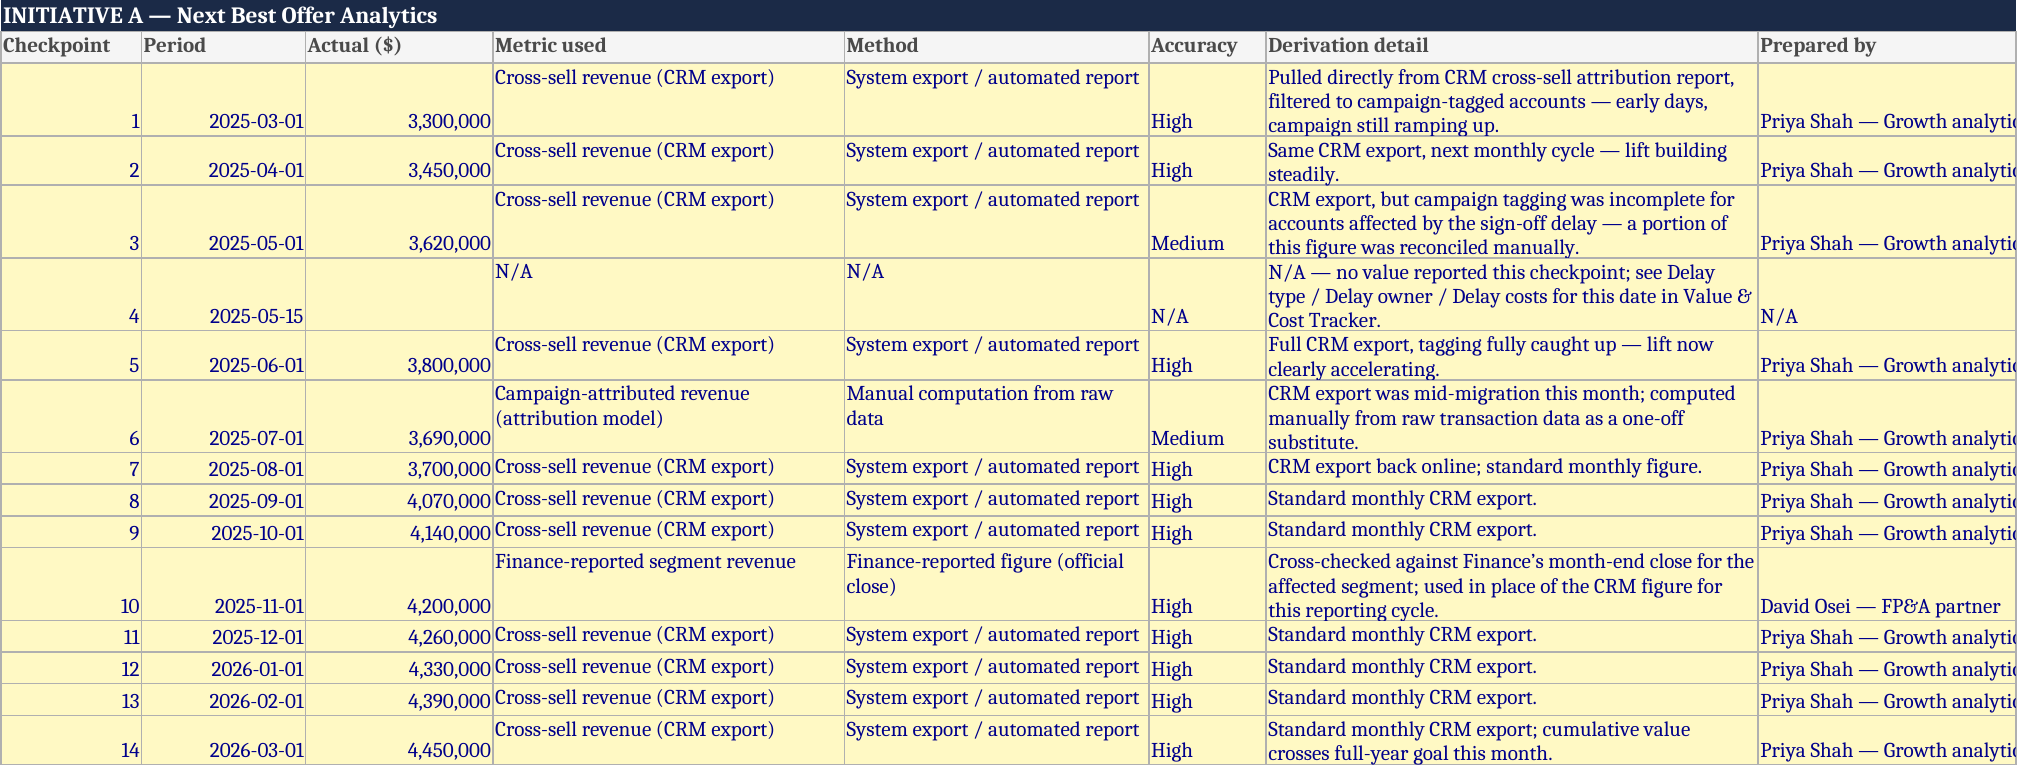
Business-as-Usual vs. Actual
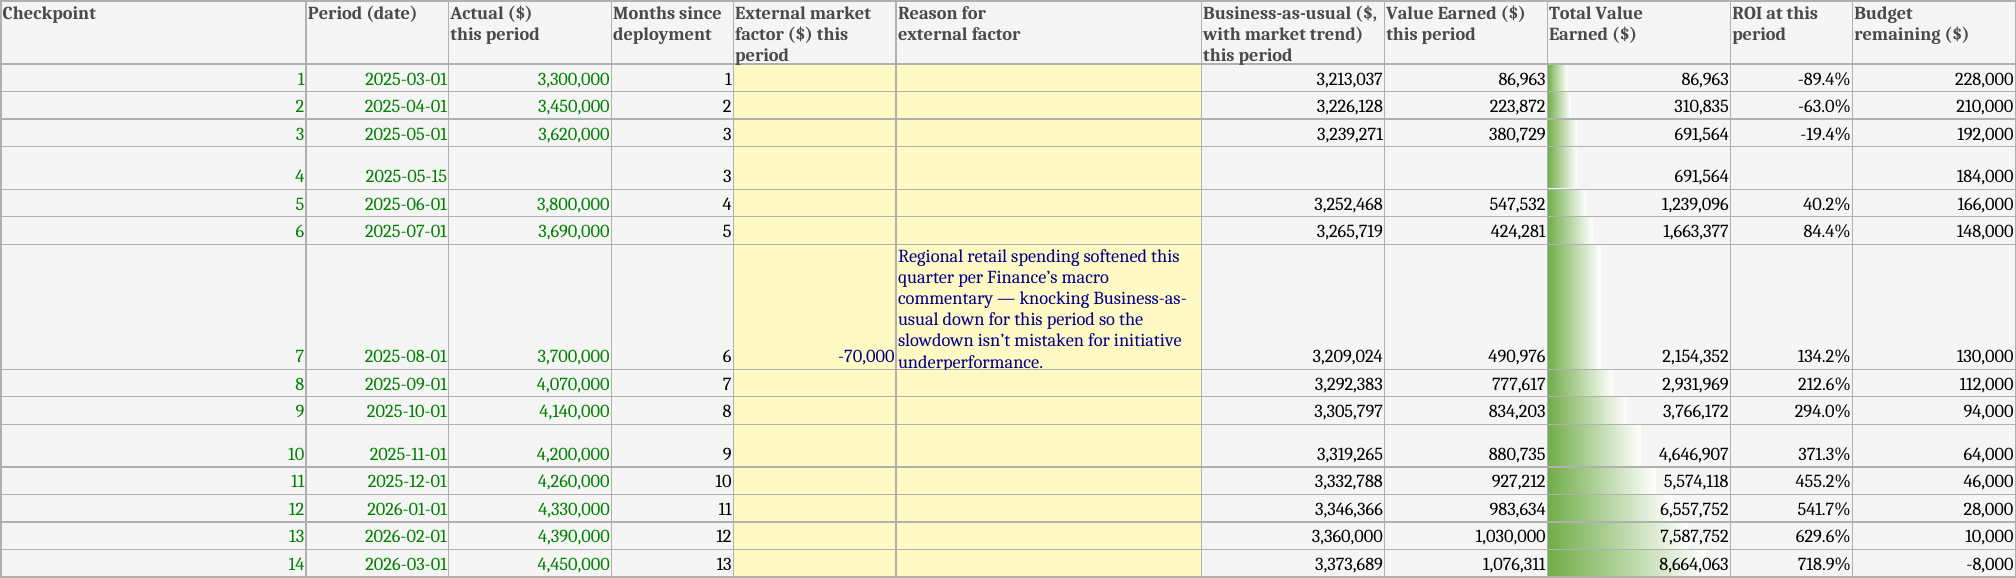
Business-as-usual for Initiative A is a trend line: what cross-sell revenue would have looked like if branch staff kept working the way they always had, growing slowly on its own momentum, with no next-best-offer engine involved. Month 1, BAU sat at $3,213,037 against an actual of $3,300,000, a gap of $86,963. That gap is Value Earned; the part of the actual number the initiative can take credit for.
One entry in the periodic table adjusts BAU directly rather than just comparing it to actual. In August 2025, regional retail spending softened bank-wide, a macro trend with nothing to do with the initiative. The ledger logs a −$70,000 External market factor that period, with a note citing Finance's macro commentary, so that softening lowers BAU instead of quietly showing up as a smaller Value Earned figure that looks like the initiative underperforming.
Value Earned
Value Earned compounds every period: $86,963 in month 1, $310,835 cumulative by month 2, climbing through the year. By February 2026, the running total sat at $7,587,752, just short of the $8,000,000 goal. One more month closed the gap: March 2026's Total Value Earned reached $8,664,063, crossing the goal with room to spare.
Approved Budget Status
Initiative A's costs break down into four one-time line items and three recurring monthly ones:
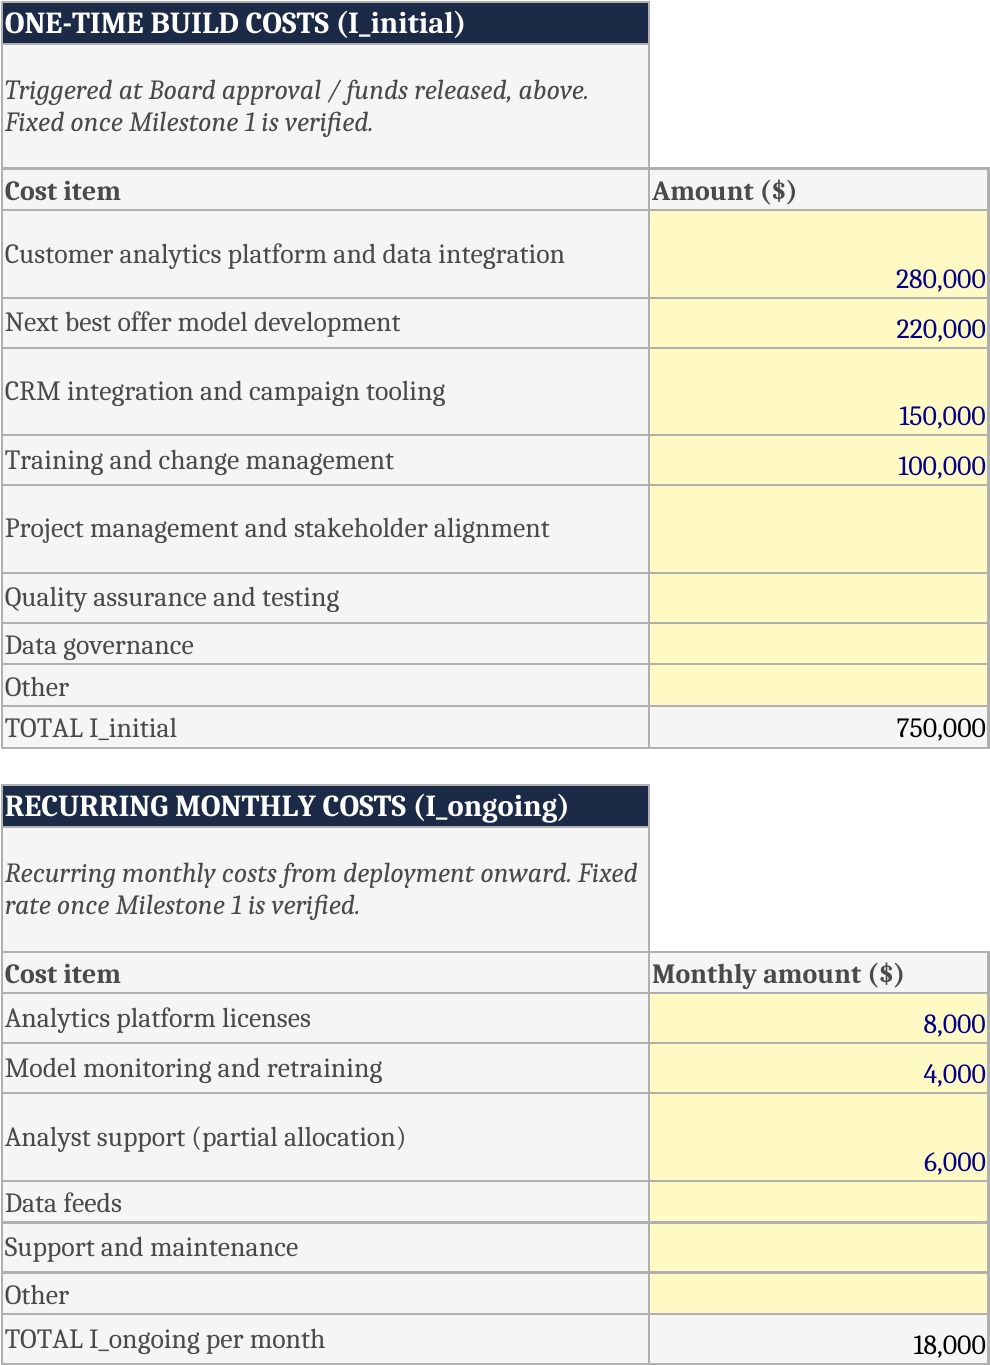
$750,000 in one-time build costs (platform and data integration, model development, CRM integration, training), and $18,000 every month from deployment onward (platform licenses, model monitoring and retraining, partial analyst support). That $18,000/month is ongoing, it doesn't shrink or pause once an initiative graduates, and it can grow if Meridian's team later expands what the model covers, effectively layering fresh scope and fresh cost onto an initiative that already proved itself.
Total Cost to Date across 13 months: $750,000 + $54,000 test-phase + $234,000 accrued I_ongoing + $20,000 in delay costs (the kind we'll come back to) = $1,058,000, against an Approved Budget of $1,050,000. Initiative A is $8,000 over.
That $8,000,000 Goal measures additional gross profit credited to Meridian's overall P&L. None of it is earmarked to cover the $18,000/month I_ongoing keeps costing. The two sit on the same P&L but aren't mechanically linked. Meridian pays I_ongoing from its normal operating budget the same way it would for any other standing tool.
In practice, Initiative A's strong ROI makes Initiative A's strong ROI makes continuing to fund I_ongoing an easy call.
Tracking Mode in Practice
Initiative A tracks value through milestone checkpoints: 25%, 50%, 75%, and 100% of its $8,000,000 goal, planned for months 3, 6, 9, and 12. It ran behind that plan for most of its life. The 25% milestone, planned for month 3, wasn't crossed until month 6, three months late, the same stretch that includes a T2A delay logged in May 2025: a campaign sign-off that took longer than planned during QA review. The 50% milestone landed in month 9, also three months behind. But the gap narrowed from there: 75% arrived in month 11, two months late, and the full goal was reached in month 13, just one month behind its original month-12 target.
That narrowing is the story milestone tracking is built to show: whether an initiative is catching up or falling further behind.

Foregone Value
Foregone Value for Initiative A: $0. An initiative that reaches its goal, even a month late, has no gap left to measure. Foregone Value only accumulates while an initiative is behind where it should be, and Initiative A closed that gap before its Value Earned was measured against it.
Lifecycle Stage
Graduated (steady-state) changes how often the initiative gets reviewed. The spending continues at the same pace as planned. Before graduation, Initiative A was evaluated each cycle for a stop-or-continue decision, the same scrutiny B and C are still under. After graduation, its $18,000/month gets absorbed into Meridian's standing operating budget like any other established tool, no annual re-justification required, even though the cost itself keeps recurring exactly as before.
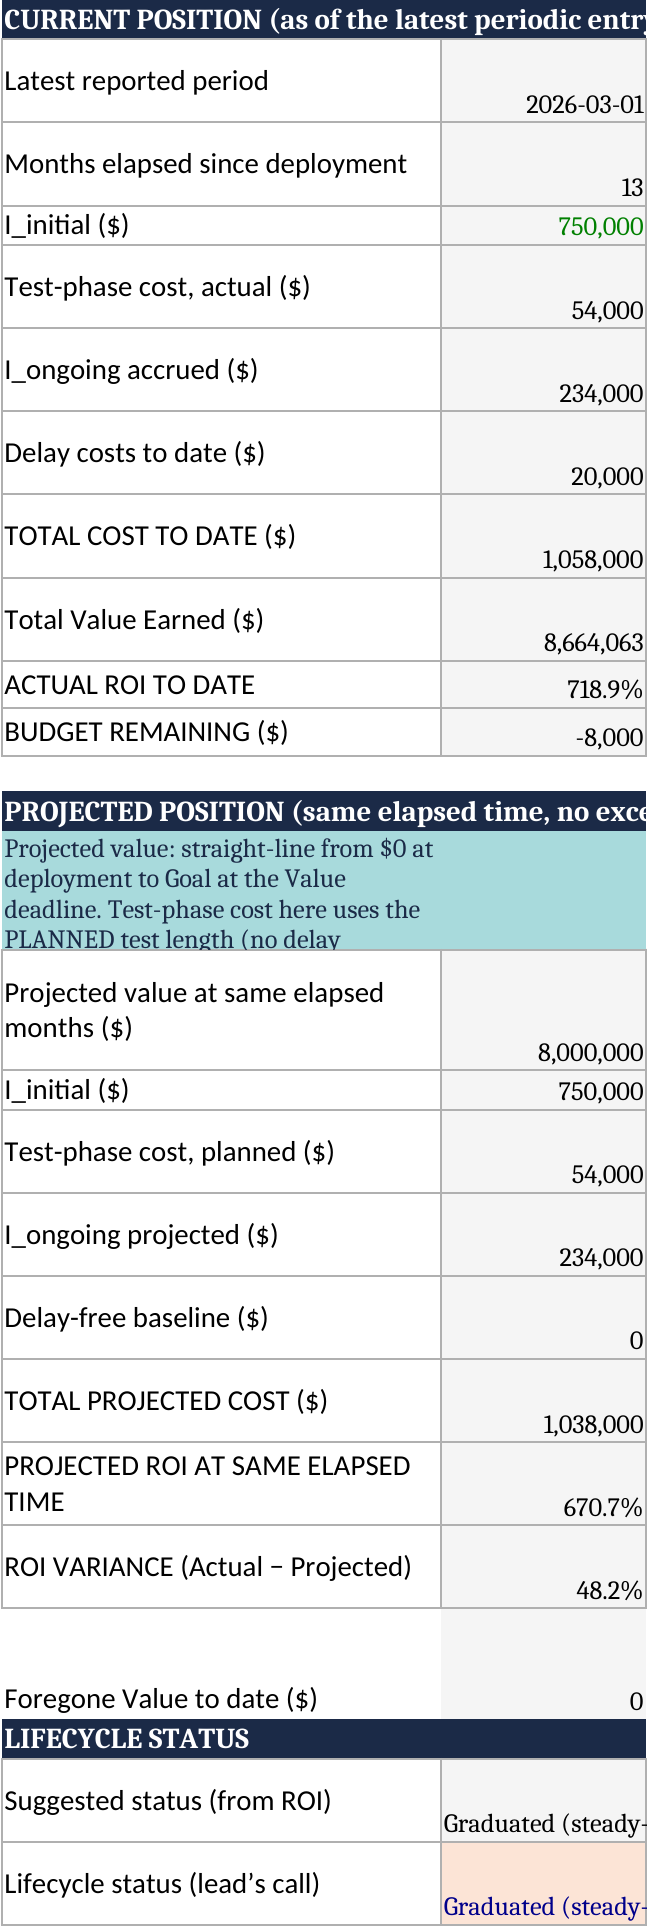
Result: 719% ROI, on an initiative that ran three months behind its own milestones for most of the year, cost $8,000 more than approved, and still closed the gap and graduated.
Initiative B: Credit Default Risk Model (the loss-avoidance lever)
The problem: Loss rates on a specific unsecured lending portfolio had drifted above Meridian's risk appetite, and the scorecard behind it hadn't been refreshed in years, an aging control gap an internal audit flagged directly.
The solution: a new default risk model built jointly by Credit Risk Management and Core Banking Integration, sponsored by the Chief Risk Officer.
The goal: $3,000,000 in avoided losses, 25% of a $12,000,000 annual loss baseline on the affected portfolio. Approved Budget: $900,000. Value deadline: 15 months.
Data Sources
Wei Zhang on the credit risk analytics team logs most checkpoints, pulled from the risk platform's quarterly loss report, filtered to the model's target portfolio segment. Checkpoint 2, April 2025, breaks that pattern: the risk system report was still under validation that quarter, so Angela Ruiz, the Chief Risk Officer herself, stepped in with Finance's provisioning figure as the closest available substitute, rated Medium accuracy instead of High.

Business-as-Usual vs. Actual
Initiative B runs the formula in the opposite direction from Initiative A. A is Revenue Generation, so Value Earned is Actual minus BAU, more revenue than the baseline predicted. B is Cost Avoidance, so Value Earned is BAU minus Actual, fewer realized losses than the baseline predicted. Checkpoint 1: BAU projected $3,022,251 in expected losses, Actual came in at $2,700,000, a $322,251 gap the model gets credit for avoiding.
October 2025's checkpoint carries an External market factor too, but pointed in the other direction from Initiative A's: +$80,000, not a deduction. Broader consumer credit stress hit the industry that quarter, which would have pushed losses up with or without the model. The ledger raises BAU by that $80,000 so the model isn't shortchanged credit for a tougher macro backdrop it didn't create.
Value Earned
$322,251 in the first checkpoint, climbing to a cumulative $2,697,459 by January 2026, the latest reported period. That's short of the $3,000,000 goal, sixteen months into a fifteen-month plan.

Approved Budget Status
Initiative B's costs: $420,000 in one-time build (risk model build and data integration, underwriting workflow tooling, implementation and validation), $22,000/month in I_ongoing (model monitoring and validation, credit bureau data feeds, incremental risk analyst support).
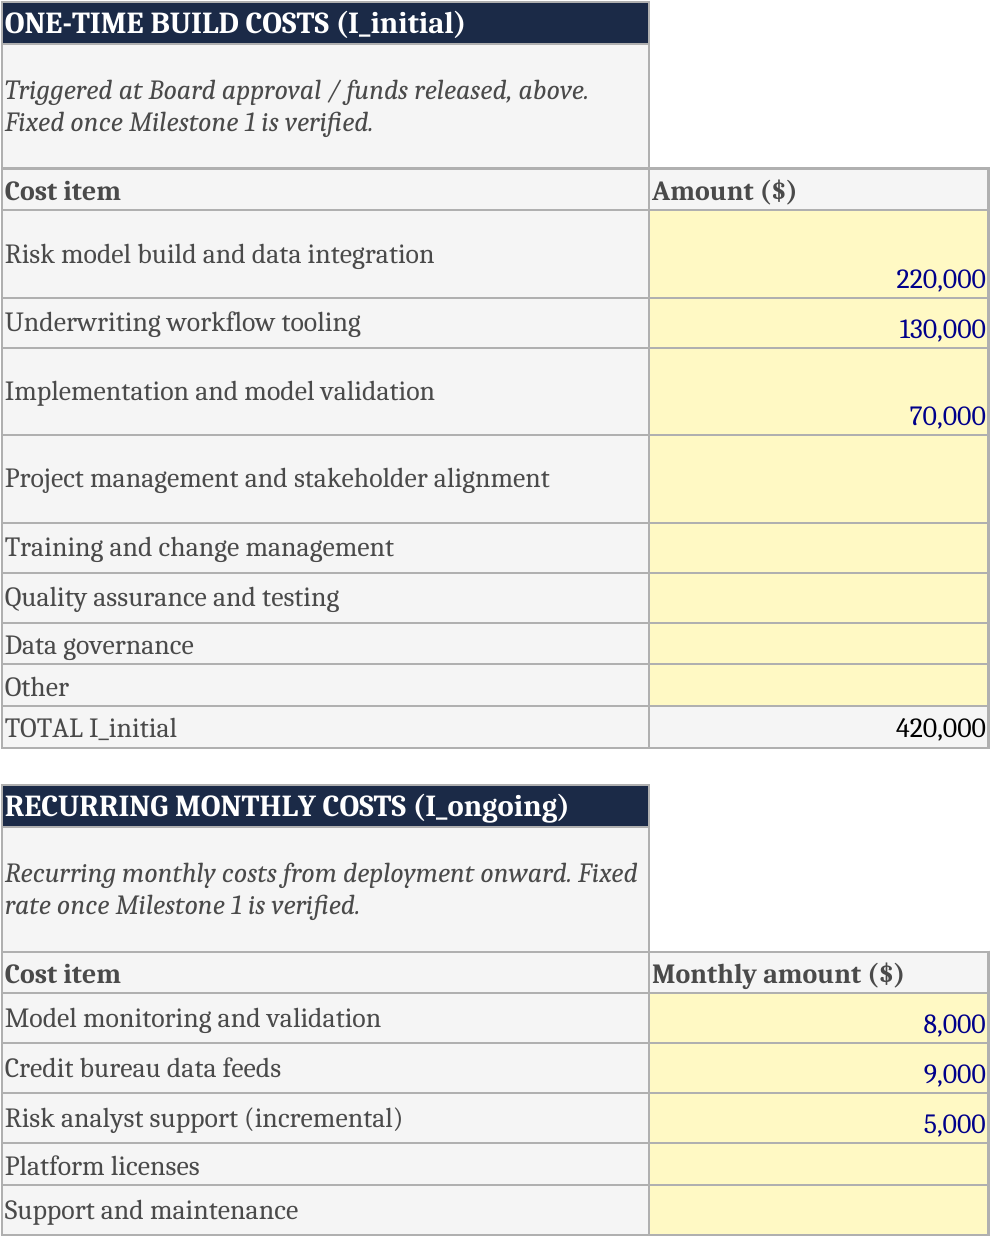
Total Cost to Date: $420,000 + $88,000 test-phase + $352,000 accrued I_ongoing + $10,000 delay costs = $870,000, against an Approved Budget of $900,000. Initiative B has $30,000 remaining, the only one of the three still under budget.
Tracking Mode in Practice
Initiative B's Milestone Crossings table logs each threshold with a planned month, an actual month, and how late it landed. The 25% milestone, planned for month 4, was reached in month 7, three months late, the same quarter a T2I delay was logged: an additional model validation cycle approved after that first milestone landed behind plan. The 50% milestone came in month 10 against a planned month 8, two months late. 75% arrived in month 13 against a planned month 11, also two months late. The 100% milestone, planned for month 15, hasn't been reached yet, and the initiative is now in month 16.

Foregone Value
Foregone Value for Initiative B is $302,541. Sixteen months in, one month past its own planned finish line, it has avoided less in losses than it should have by now.
Lifecycle Stage
Underperforming, positive ROI — both the formula's suggestion and the business owner's actual call. Initiative B is genuinely behind its own plan and past its own deadline. It has also returned $2,697,459 against $870,000 spent, a substantial gain. Underperforming describes the initiative's pace against its own plan. Positive ROI describes whether the money already spent has been worth it. That's why Lifecycle Stage and ROI are tracked as two separate signals.
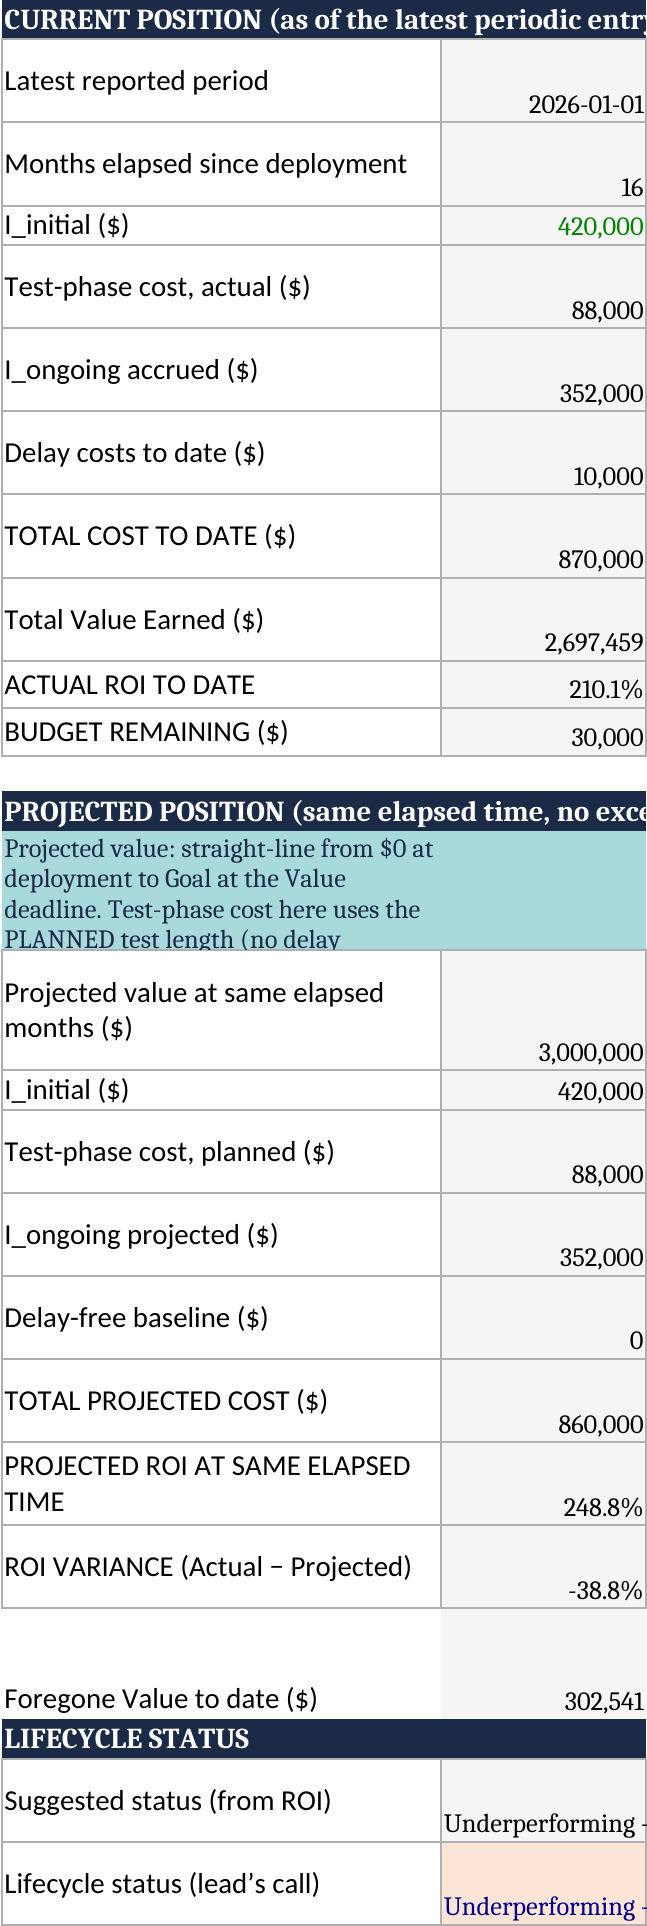
Result: 210% ROI, $302,541 in foregone value, one milestone still open past its planned deadline. Initiative B is behind schedule and still worth funding.
Initiative C: Regulatory Reporting Automation (the cost lever)
The problem: Every regulatory reporting cycle meant manually reconciling six source systems that didn't agree with each other, work that had already produced two near-miss filing errors in the prior year. The solution: an automation build scoped jointly by Regulatory Reporting & Compliance and the Data Platform team, escalated to the board risk committee as an operational risk item and funded from there. The goal: $2,600,000 in cost reduction, 40% of a $6,500,000 baseline reporting cost. Approved Budget: $550,000. Value deadline: 12 months.
Data Sources
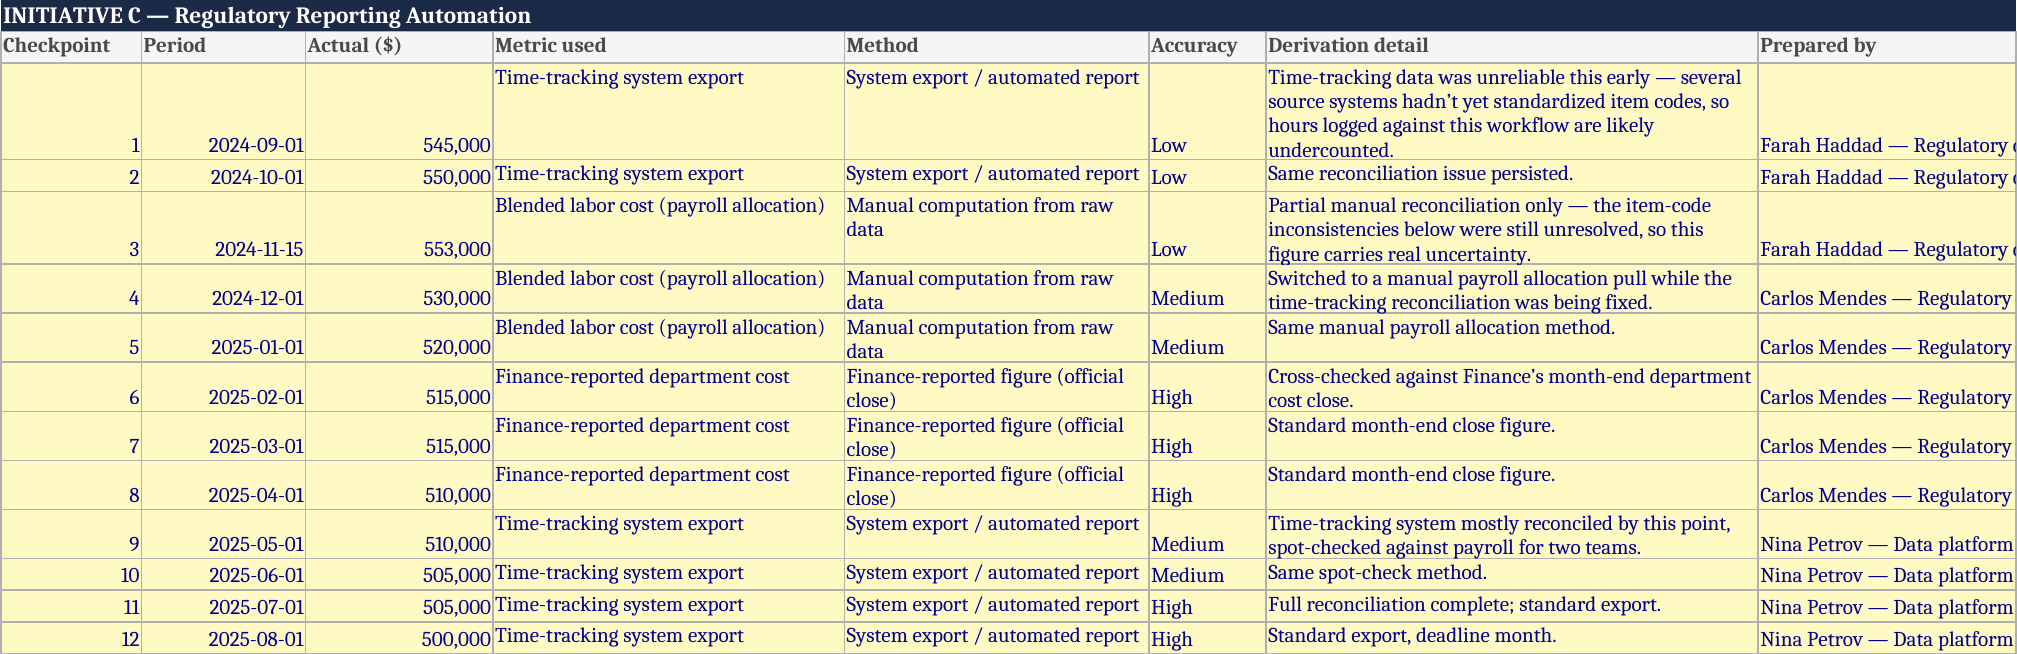
Twelve checkpoints, September 2024 through August 2025, spread across three different preparers as the underlying data problem got fixed in stages. The first two checkpoints, prepared by Farah Haddad, are rated Low accuracy, the ledger's own note explaining why: several source systems hadn't yet standardized item codes, so hours logged against this workflow were likely undercounted. Checkpoint 4 shifts to Carlos Mendes in Finance, using a manual payroll allocation pull while the time-tracking reconciliation was being fixed, Medium accuracy. By checkpoint 6, Finance's own month-end close became the source, High accuracy, and by checkpoint 11, Nina Petrov's team had the time-tracking export fully reconciled.
Business-as-Usual vs. Actual
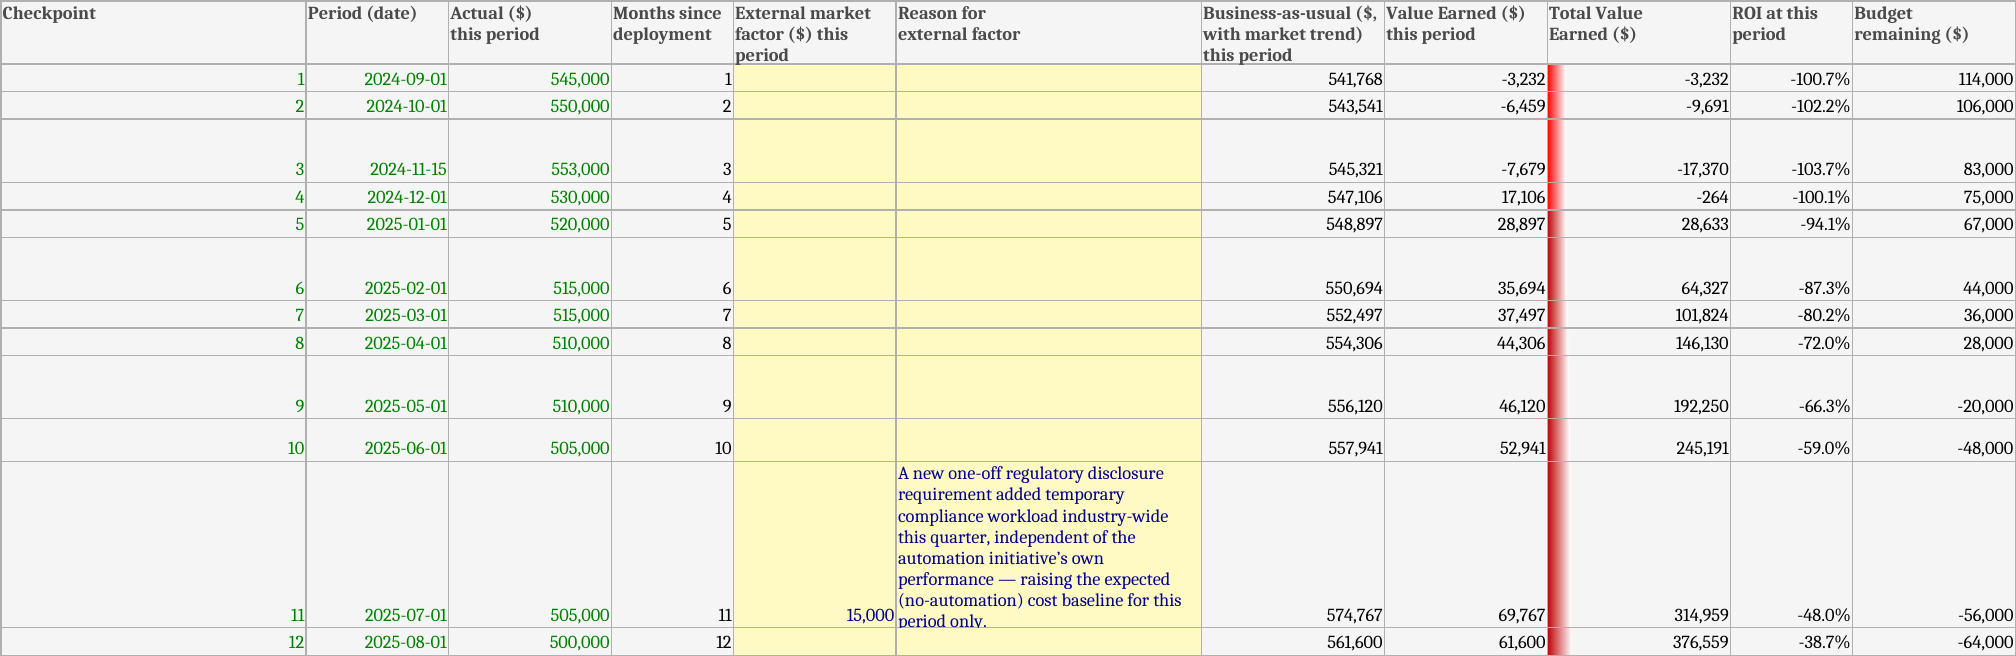
Initiative C measures the same way Initiative B does, Cost Avoidance direction, Value Earned as BAU minus Actual, except here Actual is the cost of running the manual reporting process each month, and a shrinking Actual is the win. Checkpoint 1: BAU (what the manual process should have cost, given a 4% annual trend) was $541,768, Actual came in at $545,000, higher than the baseline. Value Earned that period: −$3,232. Initiative C started by costing more than doing nothing.
Checkpoint 11, July 2025, carries an External market factor of +$15,000: a new one-off regulatory disclosure requirement added temporary compliance workload industry-wide that quarter, independent of the automation initiative's own performance. The ledger raises BAU that period so the initiative isn't penalized for a cost increase it didn't cause.
Value Earned
Value Earned turned positive at checkpoint 4 ($17,106) and climbed slowly from there, reaching $376,559 cumulative by August 2025, the latest reported period. Against a $2,600,000 goal, that's about 14.5% achieved, twelve months into a twelve-month plan. Reaching a deadline at 14.5% of goal is a different conversation than the one that got this initiative approved.
Approved Budget Status
$380,000 in one-time build costs (data pipeline across six source systems, report automation and formatting layer, validation and testing), $8,000/month in I_ongoing (platform licenses and maintenance, model monitoring and retraining).
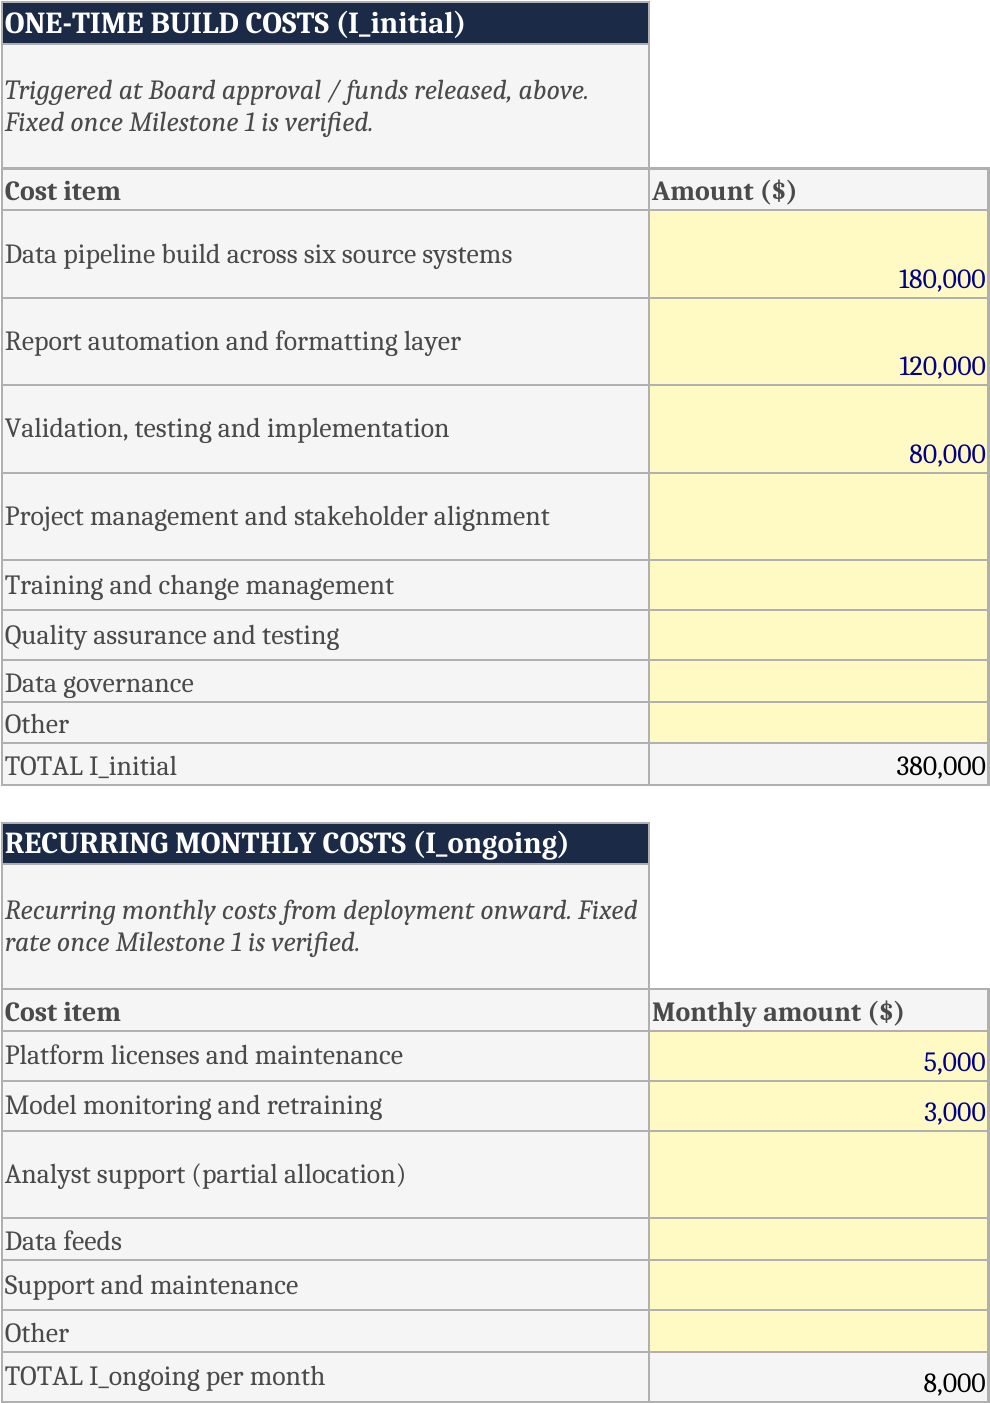
Total Cost to Date: $380,000 + $48,000 test-phase + $96,000 accrued I_ongoing + $90,000 in delay costs (the largest of the three, and the one we'll unpack fully in the next section) = $614,000, against an Approved Budget of $550,000. Initiative C is $64,000 over, the largest overrun of the three.
Tracking Mode in Practice
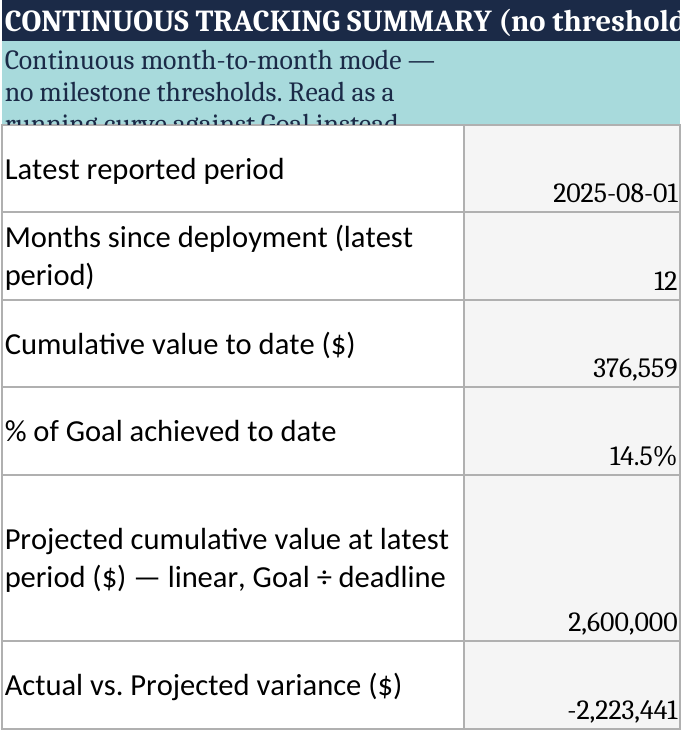
Initiative C tracks value continuously, month to month, no milestone thresholds. Its own summary reads as a running curve against Goal instead of a series of crossings: $376,559 earned against a straight-line projection of $2,600,000 at the same twelve-month mark, a variance of −$2,223,441. Continuous tracking flags that gap every month, the moment the actual curve sits below the projected one.
Foregone Value
$2,223,441. The largest number in Meridian's portfolio, and the same figure the continuous tracking summary already showed as variance. This is what twelve months of missed cost targets look like when there's no milestone to catch up along the way.
Lifecycle Stage
Negative ROI, both the formula's suggestion and the business owner's actual call. Initiative C has spent $614,000 to earn back $376,559, a real loss to date, on top of $2,223,441 in value that should have existed by now and doesn't.
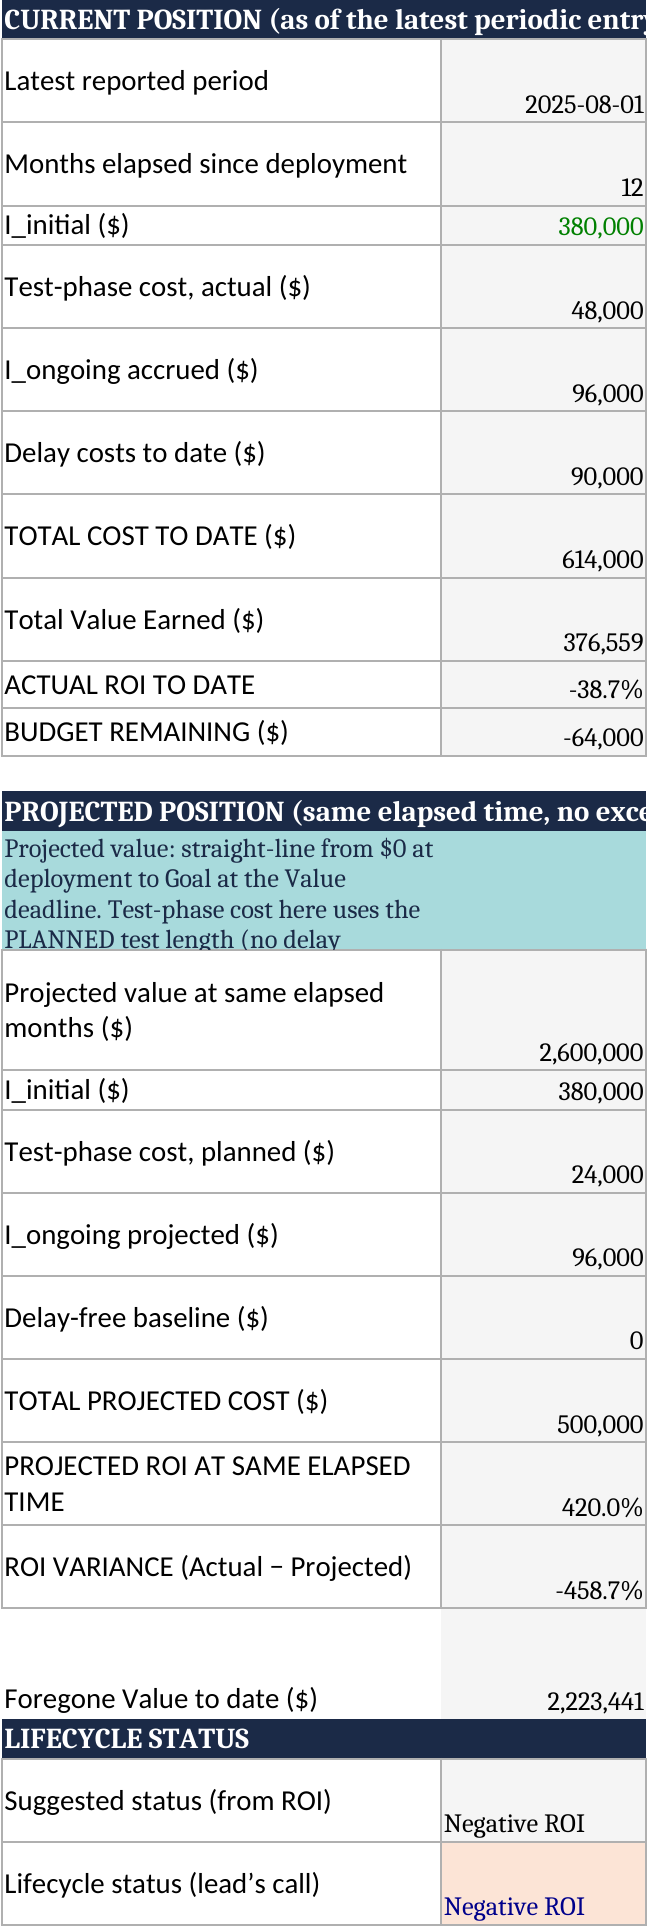
Result: −38.7% ROI, $2,223,441 in foregone value, $64,000 over budget, twelve months in on a twelve-month plan with 14.5% of the goal reached.
The Portfolio, All at Once
Three initiatives, three lifecycle stages, one dashboard. $11,738,081 earned against a combined $13,600,000 goal, 86.3% of the portfolio's total target, for $2,542,000 spent. Blended across all three: 361.8% ROI.
The 361.8% blended ROI is worth pausing on. It's a positive figure, and it's also hiding two initiatives that need a decision and one that's already made its call. Portfolio-level ROI answers "is Meridian's data and analytics spending worth it overall?" It doesn't answer "which of these three should keep getting funded." Those are different questions, and the dashboard is built to answer both, at the row level and the portfolio level, without letting one hide the other. 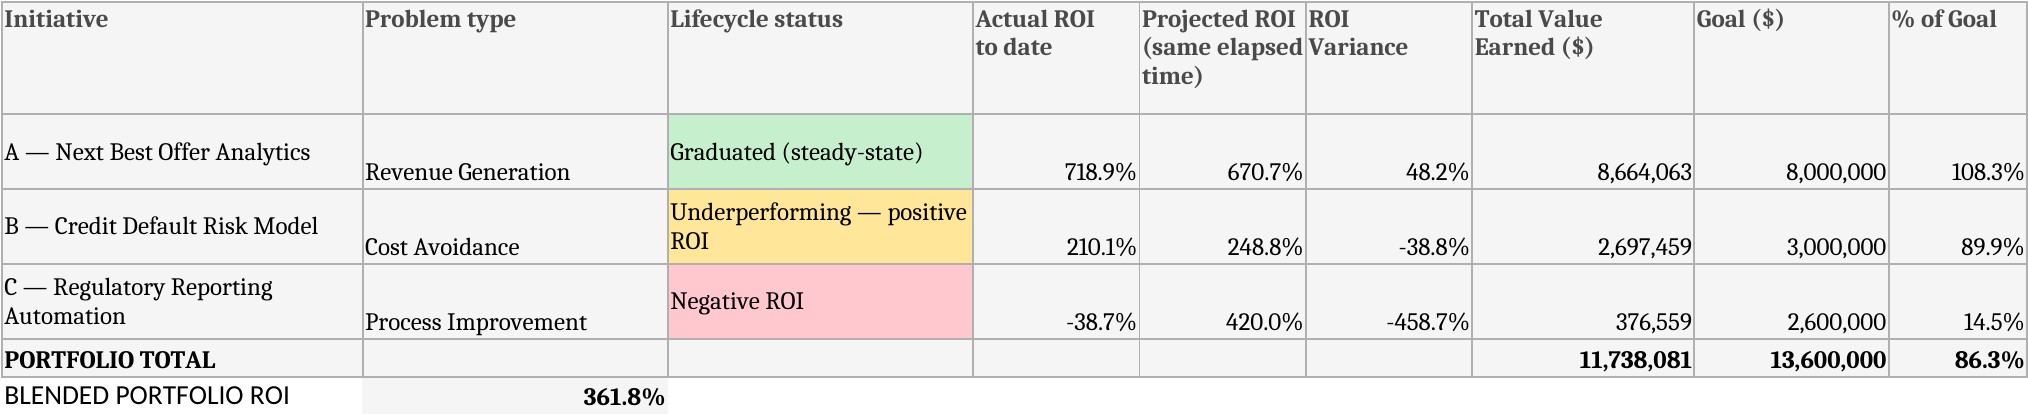
Delay, in Practice
Every initiative in Meridian's portfolio logged at least one delay or budget exception. Each one has a named owner, a dollar cost, and a note explaining what happened.
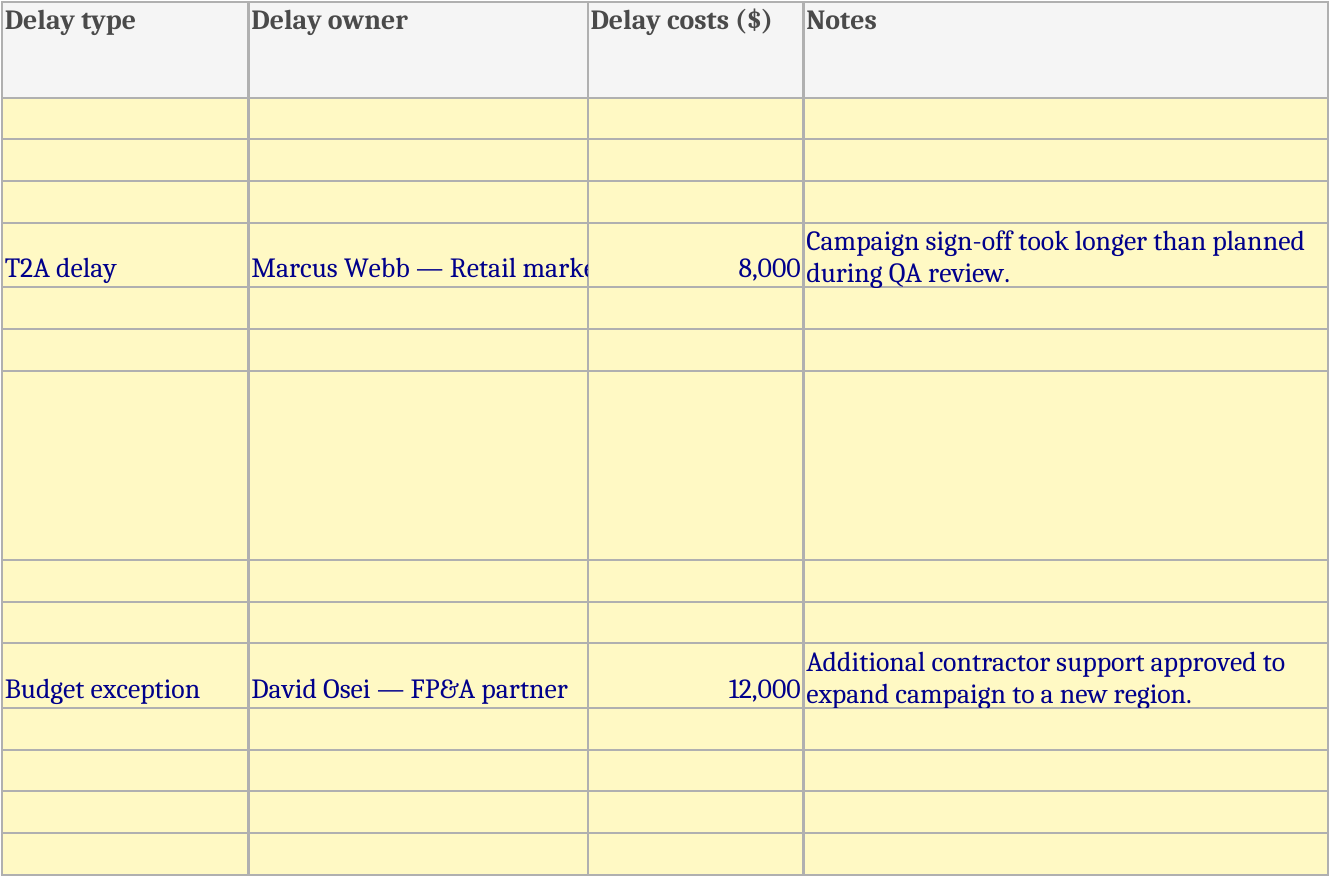
Initiative A: $20,000 in delay costs. A T2A delay in May 2025, campaign sign-off took longer than planned during QA review, cost $8,000 and belonged to Marcus Webb, the Retail Marketing VP. A Budget exception in November 2025, additional contractor support approved to expand the campaign into a new region, cost $12,000 and belonged to David Osei in FP&A.
Initiative B: $10,000 in delay costs. One T2I delay in April 2025: an additional model validation cycle, approved after the first milestone landed behind plan. Owned by Wei Zhang on the credit risk analytics team. 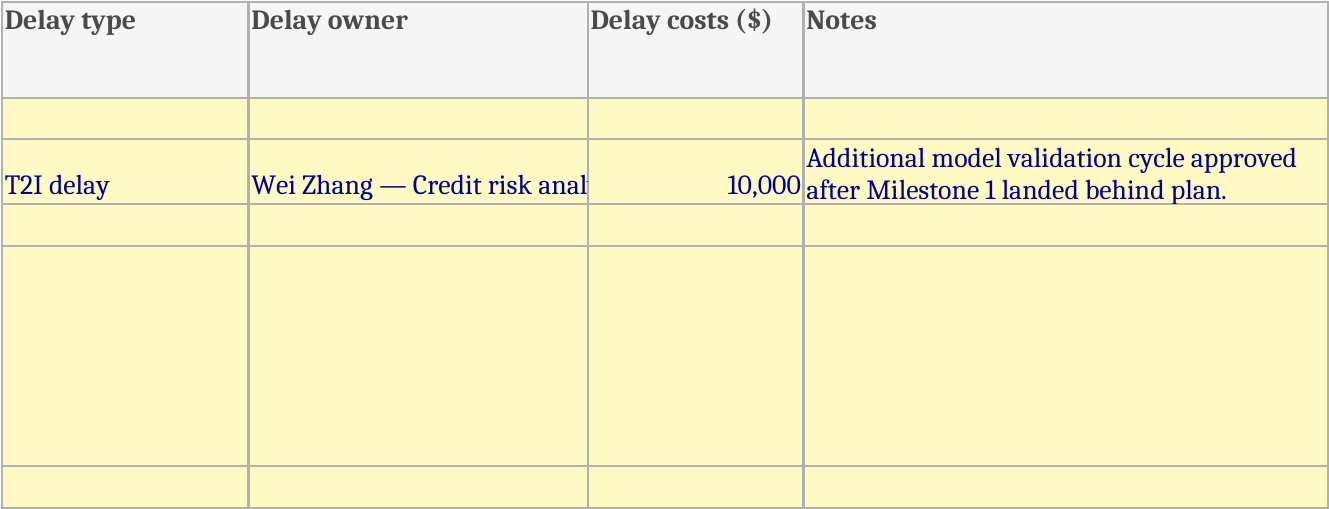
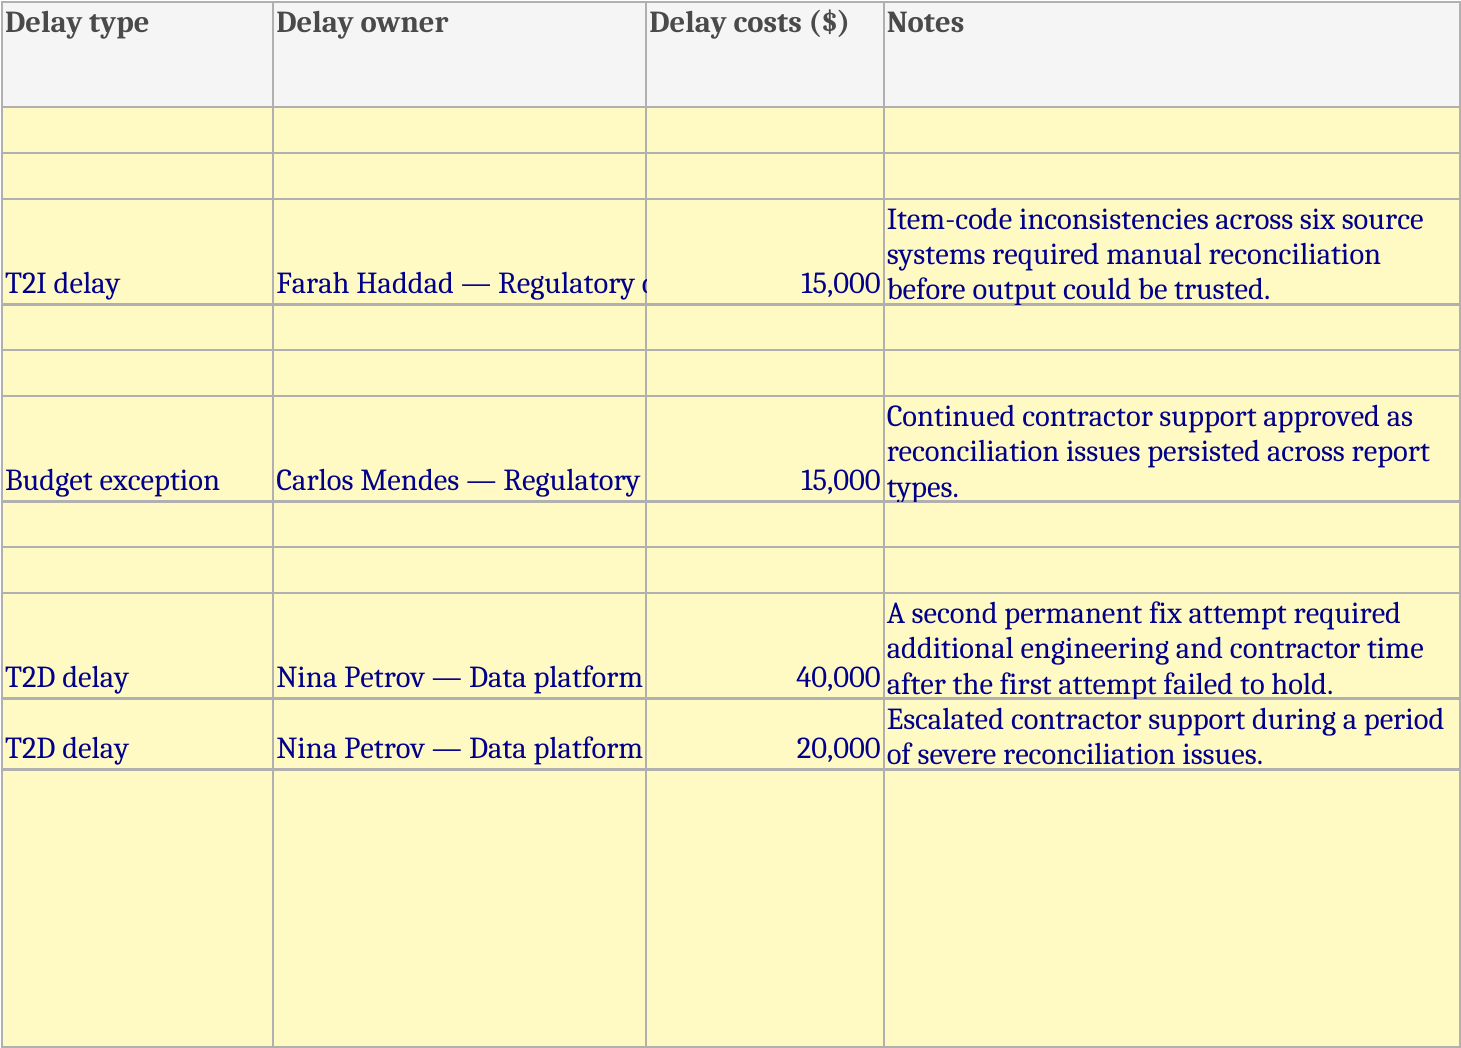
Initiative C: $90,000 in delay costs, the largest of the three, and not from one event but four. A T2I delay in November 2024, item-code inconsistencies across six source systems, $15,000, owned by Farah Haddad. A Budget exception in February 2025, continued contractor support as reconciliation issues persisted, $15,000, owned by Carlos Mendes. Two T2D delays in May and June 2025, a second permanent fix attempt after the first failed to hold, then escalated contractor support during a period of severe reconciliation issues, $40,000 and $20,000, both owned by Nina Petrov.
Delay costs are money already spent reacting to a setback: extra contractor hours, an additional validation cycle, a second attempt at a fix. They show up in Total Cost to Date and eat directly into Budget Remaining, the way $20,000 helped push Initiative A $8,000 over budget, and $90,000 is a third of why Initiative C ran $64,000 over.
Foregone Value is the value that should exist by now but doesn't. Initiative A's Foregone Value is $0, its delays cost money but didn't stop it from reaching its goal. Initiative B's is $302,541, still climbing at month 16 of a 15-month plan. Initiative C's is $2,223,441, the largest number anywhere in Meridian's portfolio, the accumulated cost of twelve months spent behind a curve that never caught up.
The pattern across all three: delay costs are the price of reacting to a setback. Foregone Value is the price of the setback itself, compounding for every month it goes unresolved.
Where This Leaves You
Every year brings a new reason to spend, a platform migration, an agentic AI rollout, whatever the next wave turns out to be. The pitch changes every year. The board asks the same question: what did we get for what we spent, and how do you know?
That question outlives every initiative in this article, and it will outlive whatever technology replaces the one behind them. Next year's budget conversation will use different words. It will still ask, in whatever words that year prefers, the same thing it always asks: is this still worth it, and how would we know if it stopped being?
This framework is a discipline for answering that question, initiative after initiative, technology wave after technology wave, long after this year's board deck has been filed away and forgotten.
Somewhere in your organization, right now, an initiative is quietly waiting for someone to ask it that same question.
If you're ready to ask it, the blank template is the same six components, empty, waiting for your numbers. [Get the template →]
Key Takeaways:
The formula surfaces the numbers. A business owner still weighs them against everything the formula can't capture, like whether a budget overrun offsets a strong ROI.
Lifecycle Stage and ROI measure different things: pace against a plan and return on money spent so far. An initiative can be behind on one and ahead on the other.
Delay produces two kinds of damage: a fixed cost from reacting to it, and a compounding cost from the value it never let happen.
Verified records alone are enough to backdate an initiative's history and produce a defensible number today, even without a full ledger from day one.
A blended portfolio ROI answers whether the group of initiatives is worth funding overall. A healthy blended number doesn't mean every initiative underneath it is fine.
You Might Also Like



Talk To Us
Let's build your data strategy.
Tell us where your data is today, and we will show you the climb from here. Based in Denver, working with teams everywhere.