
Data & Analytics ROI, Part Two: Six Components of a Defensible Number

Abdul Fahad Noori
September 8, 2026

Abstract: A defensible ROI number compares what happened against what would have happened anyway, and that second half is never directly observable. This article breaks that problem into six components. It covers who should own each part of the setup and how to get started, whether an initiative hasn't been deployed yet or has already been running for months without a tracking history.
Read time: 20 mins.
You’ll learn:
How to identify which of the three initiative types you're measuring, Revenue Generation, Cost Avoidance, or Process Improvement, and why that determines which direction the formula runs
Business-as-usual (BAU), Value Earned, Approved Budget, Initial Investment (I_initial), Ongoing Investment (I_ongoing), and Foregone Value.
The four roles that should own different parts of the setup, and the two ways to track progress once an initiative goes live
The groundwork worth doing before deployment, so the ledger produces a trustworthy number from the start instead of one assembled under pressure later
How the framework applies equally to a new initiative and to one that's already been running for months
Every ROI number rests on a comparison: what happened, against what would have happened without the initiative. The second half of that comparison, the "without," is never observed. In most cases, it is an estimate. Every assumption behind that estimate carries straight into the final number, whether anyone spends time looking at it.
The business doesn't hold still long enough to make the comparison obvious.
Prices shift. Competitors move.
A market has a good quarter or a bad one for reasons unrelated to what was just deployed.
Whatever changes in the numbers afterward is a mix of the initiative's effect and everything else happening at the same time. There's no way to separate the two after the fact without having planned for it in advance.
The further you get from deployment without that plan, the harder the separation becomes, and the more any resulting number depends on assumptions nobody formally agreed to.
This is the second article in a series on measuring ROI of any type of initiative that improves the business. Part one addressed the upstream half of this problem: defining the business outcome, agreeing on how to measure it, and estimating what it should be worth before a single line of code gets written. This article picks up from there, turning that estimate into a defensible number once the work is live. It stands on its own if you’ve not read part one.
A quick note before diving in. This article uses an illustrative company, Meridian Regional Bank, to make the framework more concrete rather than abstract. The following use cases demonstrate the ROI calculations:
Next Best Offer Analytics growing revenue,
a Credit Default Risk Model avoiding losses,
and Regulatory Reporting Automation reducing process costs
When you start gathering data and metrics for your own use case, your ROI calculations will look different; that's expected. The filled Meridian workbook is there to show you how to fill in your own.
Two versions of this workbook to help you streamline your effort:
Download >>> The filled Meridian Regional Bank workbook: every sheet is populated with Next Best Offer Analytics, the Credit Default Risk Model, and Regulatory Reporting Automation, walked through in full in Part Three. Use it to see how a finished, real-looking version reads before you build your own.
-
Download >>> The blank template: the same structure with nothing entered, offered at the end of this article and again at the end of Part Three. Use it to set up your own initiative once you're ready to start.
Note: This framework doesn't require a clean start. If you're setting up a new initiative, it applies from day one. If you're picking up something that's already deployed and running, you can start tracking today and work backward with whatever records you can verify. [We walk through exactly how in part three→]
Three Problem Types in Data & Analytics
Every initiative in this space is trying to do one of three things: make something bigger, make something smaller, or make an internal cost smaller. That distinction sounds almost too simple to matter, but it's the first fork in the road, and it decides how the rest of this framework gets applied. The framework itself doesn't change based on which type it's applied to. It's built to work the same way across all three, whether the underlying solution is a model, a dashboard, an automation, or something else entirely.
Revenue Generation is the most familiar shape, a business trying to grow something that isn't growing fast enough on its own. A retailer using customer data to run sharper, more targeted campaigns instead of generic ones. A bank using behavioral signals to offer the right product to the right customer at the right moment. The initiative doesn't create a new source of revenue out of nothing. It makes existing revenue grow faster than it otherwise would have.
Cost Avoidance runs the opposite direction; a business trying to shrink a loss that's happening to it from the outside. Fraud slipping past manual review. Loan defaults that a stale, years old risk model no longer predicts well. Compliance penalties from something that should have been caught earlier. The win here is damage that stops happening.
Process Improvement looks like Cost Avoidance but points inward instead of outward, a business trying to shrink the cost of its own making. Manual work that eats analyst’ hours. A reporting process spread across six disconnected systems. Rush orders and pricing inefficiencies from a purchasing process that reacts instead of plans. Nothing external is attacking the business here. The business is simply spending more than it needs to on its own operations.
Figure 1: Three Use Cases for ROI Calculations
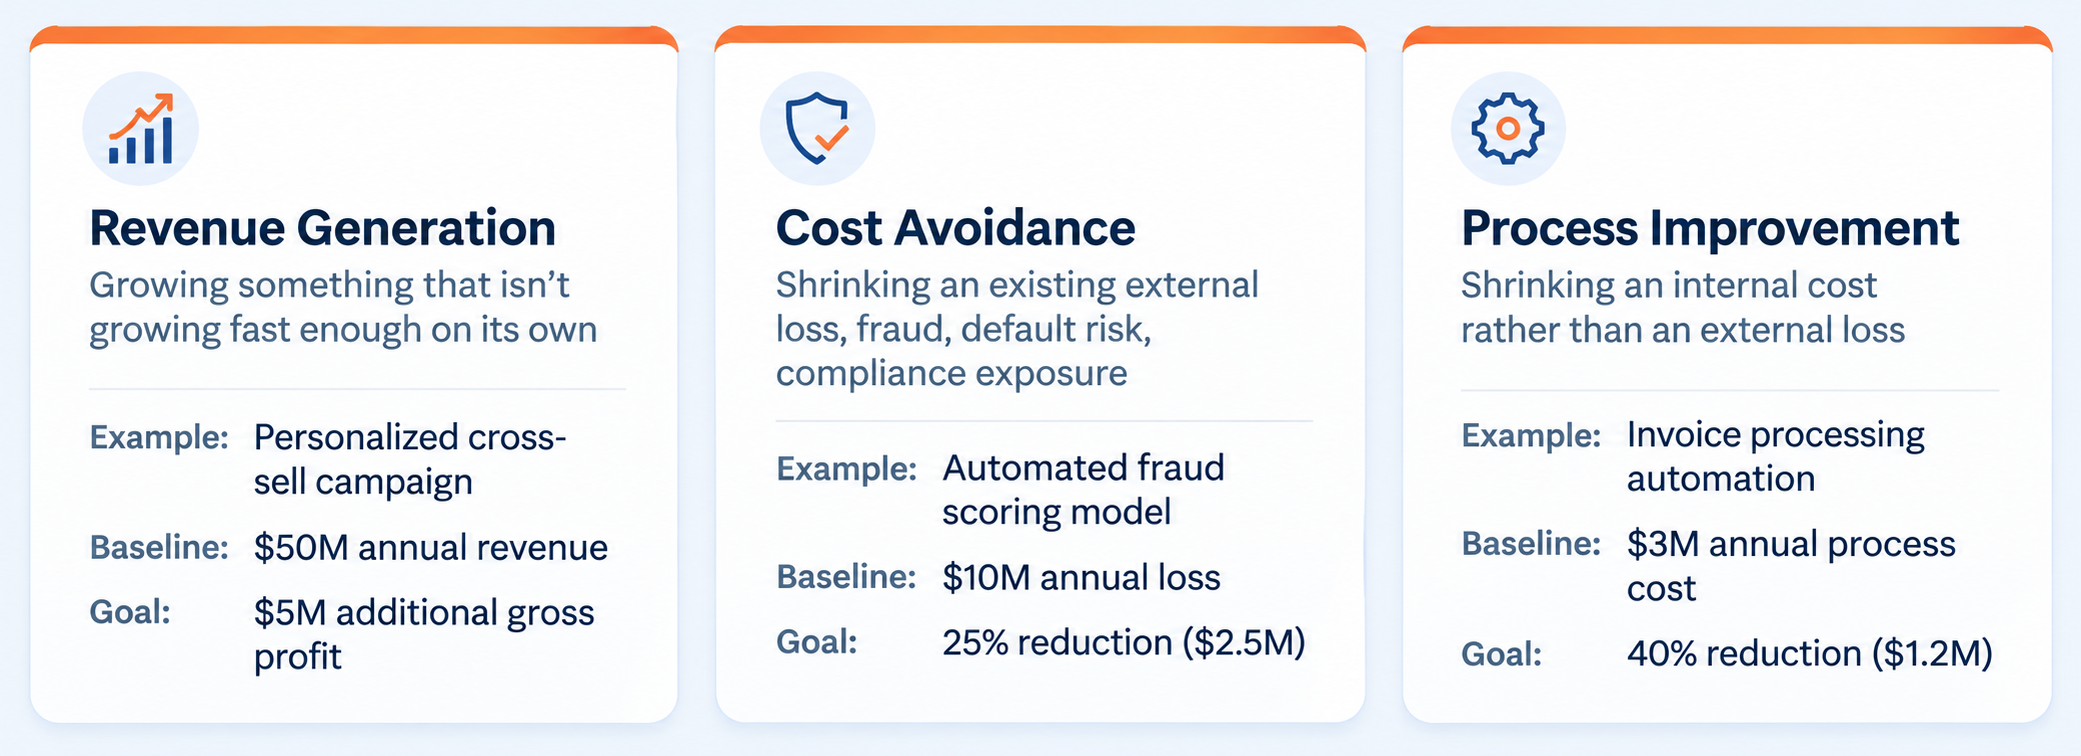
Three different situations, and three different reasons a business might commission a solution in the first place. What they share is that each one implies a number: how much bigger, or how much smaller, is success.
A handful of terms carry that number through the rest of this framework, regardless of which type it is:
Baseline: the current annual figure the initiative is measured against. Current revenue for Revenue Generation, the current loss for Cost Avoidance, and the current cost for Process Improvement.
Goal: the target improvement, stated upfront. For Revenue Generation, this is a separate dollar figure, additional annual gross profit, not derived from the Baseline. For Cost Avoidance and Process Improvement, it's a percentage reduction applied to the Baseline itself.
Gross margin: applies only to Revenue Generation, converting a revenue target into gross profit terms, since incremental revenue doesn't proportionally increase the fixed costs already running the business.
Value deadline: how many months from deployment the Goal is expected to be reached. This applies to all three types, and everything measured later in this framework is read against it.
The Formula
ROI = ((Total Value Earned − Total Cost) / Total Cost) × 100
Figure 2: ROI Formula
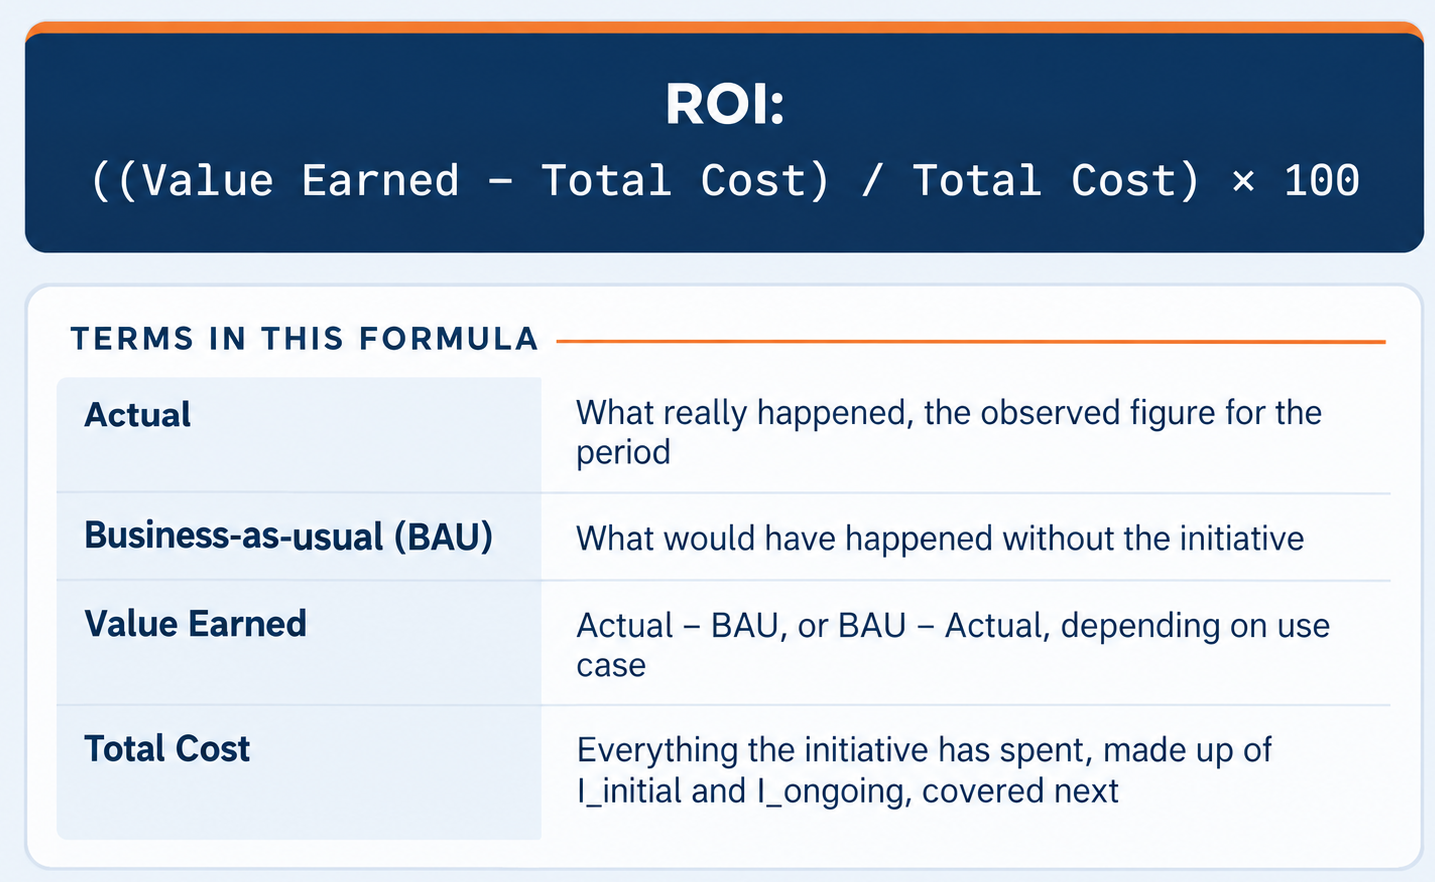
This framework draws on two sources. Avinash Kaushik's "Return on Analytics" framework [1], co-developed with Jesse Nichols, argues that an analytics investment's true cost includes not just the software but also the people behind it. It requires breaking internal headcount into implementation staff, reporting-only staff, and analysts. This framework carries that same instinct forward into Initial Investment (I_initial) and Ongoing Investment (I_ongoing)
Stephen Tracy's framework for measuring analytics delay [2] does more of the structural work here. Time to Insight (T2I), Time to Action (T2A), and Time to Deployment (T2D) are used directly, in Tracy's own definitions and order, repositioned as the diagnostic behind I_ongoing rather than standing alone as KPIs.
On top of both, this framework adds three things of its own: a counterfactual to isolate what the initiative itself is responsible for, a measurement cadence tied to business outcomes rather than calendar dates, and a sourcing standard for every figure that feeds into the calculation.
Four terms sit behind the formula, plus one figure the business decides before any of them start accumulating.
Business-as-usual (BAU)
Every ROI calculation needs to know what would have happened without the initiative. Nobody can run two versions of the same business side by side, so this framework builds a projection instead: take Baseline, and grow it forward the way it likely would have moved on its own, using the market trend the business already expected. That projection is called Business-as-usual (BAU).
Once the initiative runs, the real, observed number gets recorded separately. That's called Actual. Business-as-usual answers "what would have happened anyway." Actual answers "what really happened." Every comparison in this framework rests on the gap between those two.
Business-as-usual isn't a guess made up to fit the outcome. It's agreed on in advance, with room to note a real one-off event when one genuinely occurs, a rate change, a competitor leaving the market, a regulation landing mid-quarter. In practice, the initiative owner sets it once, at the start, and doesn't revisit it every time a new period's numbers come in.
Value Earned
Value Earned is the gap between Actual and Business-as-usual. It answers the question behind "did this work?" Not whether the number moved, but whether the initiative caused it to move.
That gap can run in either direction, depending on what the initiative is trying to do.
Growing something. Revenue, conversions, adoption. Actual needs to finish above Business-as-usual. Value Earned = Actual − BAU
Shrinking something. Losses, fraud, process cost. Actual needs to finish below Business-as-usual, a smaller number, since the loss shrank. Value Earned = BAU − Actual
The calculation doesn't change between the two. Only the direction that counts as success does, above Business-as-usual for growth, below it for reduction.
A distance between two numbers is only as accurate as the numbers themselves, and Actual is the one place reality is supposed to enter the picture, which is exactly where it's easiest to get sloppy. A figure with no source behind it is a number nobody can defend if someone questions it later.
How teams track the Actual figure
Whoever records an Actual figure for Value Earned enters it once, in one place, and the rest of the framework references it from there instead of re-entering it anywhere else it's needed. At every reporting checkpoint, each entry captures:
The period it covers
The raw figure itself, before it touches BAU
Metric and method, what the team measured and how: a query against a system of record, a finance-reconciled total, a modeled estimate
A confidence rating, high, medium, or low, describing how much judgment went into the number versus how directly it came from a source system
A derivation note, a sentence or two on how the figure came together
The preparer's name
A named preparer means there is someone to stand behind the figure when a board member questions it.
Rolling the confidence ratings up across an initiative's life produces one summary score for that initiative, high, medium, or low confidence overall.
Two ROI figures can show the same percentage and still deserve different levels of trust, one resting mostly on system-sourced numbers; the other mostly on modeled estimates. This score lets a reader see which is which without auditing every checkpoint.
This is the mechanism that makes a number verifiably real: a record of who measured what, from where, and how confident they were about it.
Approved Budget
Every other number in this framework comes after the fact. The business earns value, accumulates cost, and calculates a return only once the initiative is already running. Approved Budget is the one number the business fixes before any of that happens. It sets this once, alongside the Goal, before deployment: a single ceiling that covers the build cost, the running cost, and anything spent absorbing a delay. One figure, not three separate totals that can each quietly grow on their own.
A board doesn't approve an ROI target. It approves a budget. ROI tells you, after the fact, whether an initiative was worth what it cost. Approved Budget is what the board committed to at the start, and honoring it differs from succeeding at it: an initiative can deliver an extraordinary return and still spend more than its authorized ceiling allows.
The two questions aren't as separate as they sound. Initial Investment (I_initial) and Ongoing Investment (I_ongoing), everything Approved Budget puts a ceiling on, are the same costs sitting in the ROI formula's denominator. Cross the ceiling, and that overrun isn't a fact living off to the side. It's already inside the ROI number, pulling it down. A budget breach and an eroding return describe the same event, from two different rooms in the building.
In practice, the sheet tracks remaining room against that ceiling continuously as costs accumulate, so an overrun surfaces the moment it happens, not at the next quarterly review.
Figure 3: Total Cost and Its Ceiling
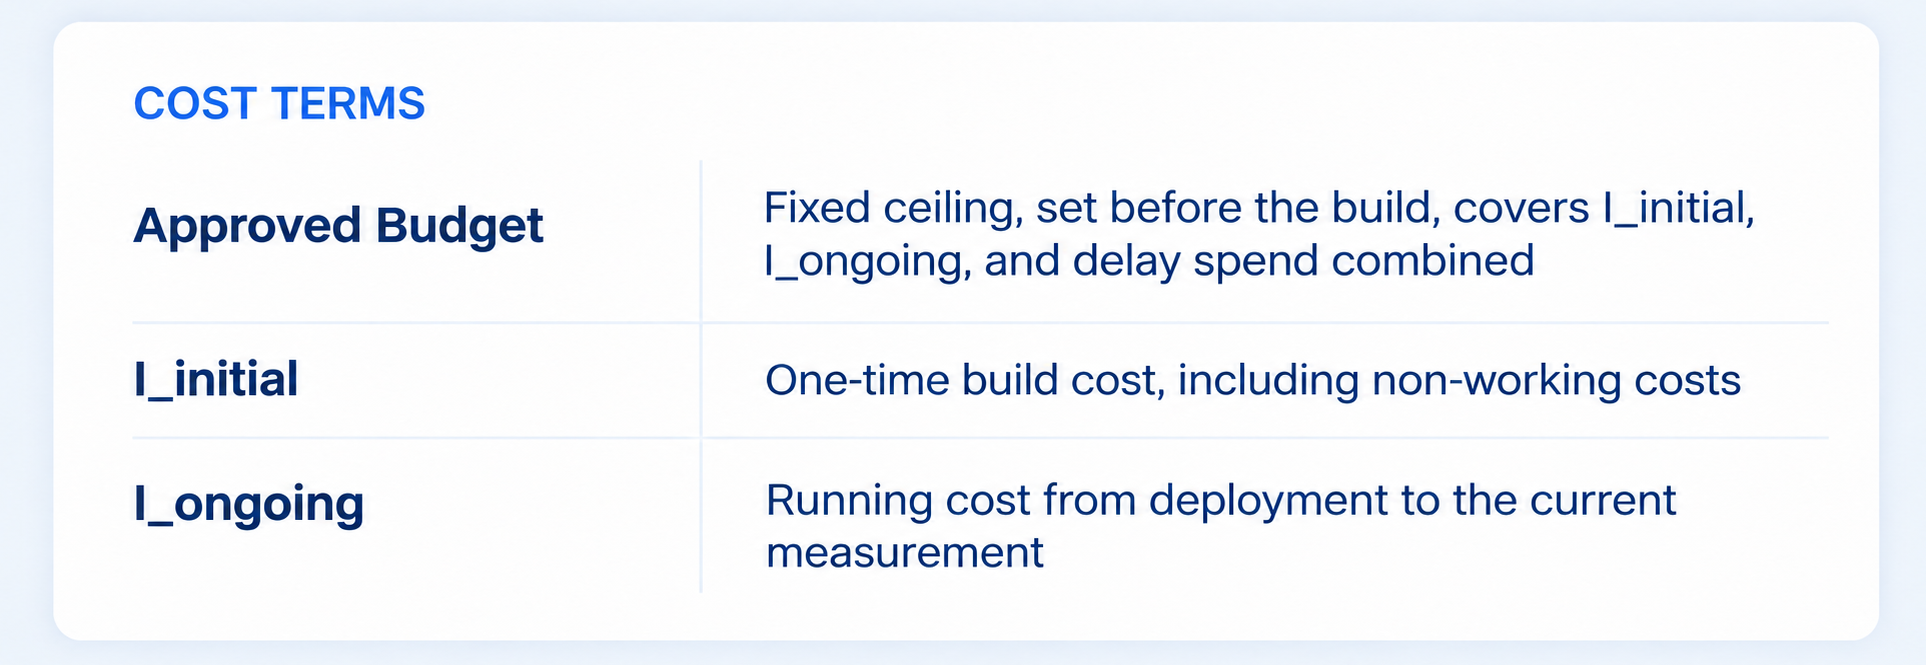
Initial Investment (I_initial)
The one-time cost of building and deploying the initiative. The obvious costs are easy to count: software, implementation, contractors. Teams leave out non-working cost more often: project management, stakeholder alignment, training, change management, quality assurance. Leaving those out understates what the initiative cost and inflates the return sitting on top of it.
In practice, the business enters this once, in Setup, alongside the Goal: a single figure it fixes before deployment and doesn't revisit as the initiative runs.
Ongoing Investment (I_ongoing)
The running total of every recurring cost from deployment to the current measurement point. Licenses, support, maintenance, personnel. This is where time enters the formula: every period that passes without value accumulating still adds to this total. Breaking that time into three stages turns it from a single number into a diagnostic:
Time to Insight (T2I): from data generation to an actionable interpretation, largely within the analytics team's control
Time to Action (T2A): from insight delivered to action initiated, largely within the business stakeholders' control
Time to Deployment (T2D): from action initiated to the change fully deployed, where organizational friction tends to live
None of the three feed the formula directly. They enter through I_ongoing: every period of delay at any stage adds cost without adding value. Tracking them separately turns "why is this taking so long" into "here's where the delay sits, and here's who owns fixing it."
In practice, this accumulates automatically as the team logs each period's costs; a running total nobody has to re-add by hand before a report is due.
Foregone Value
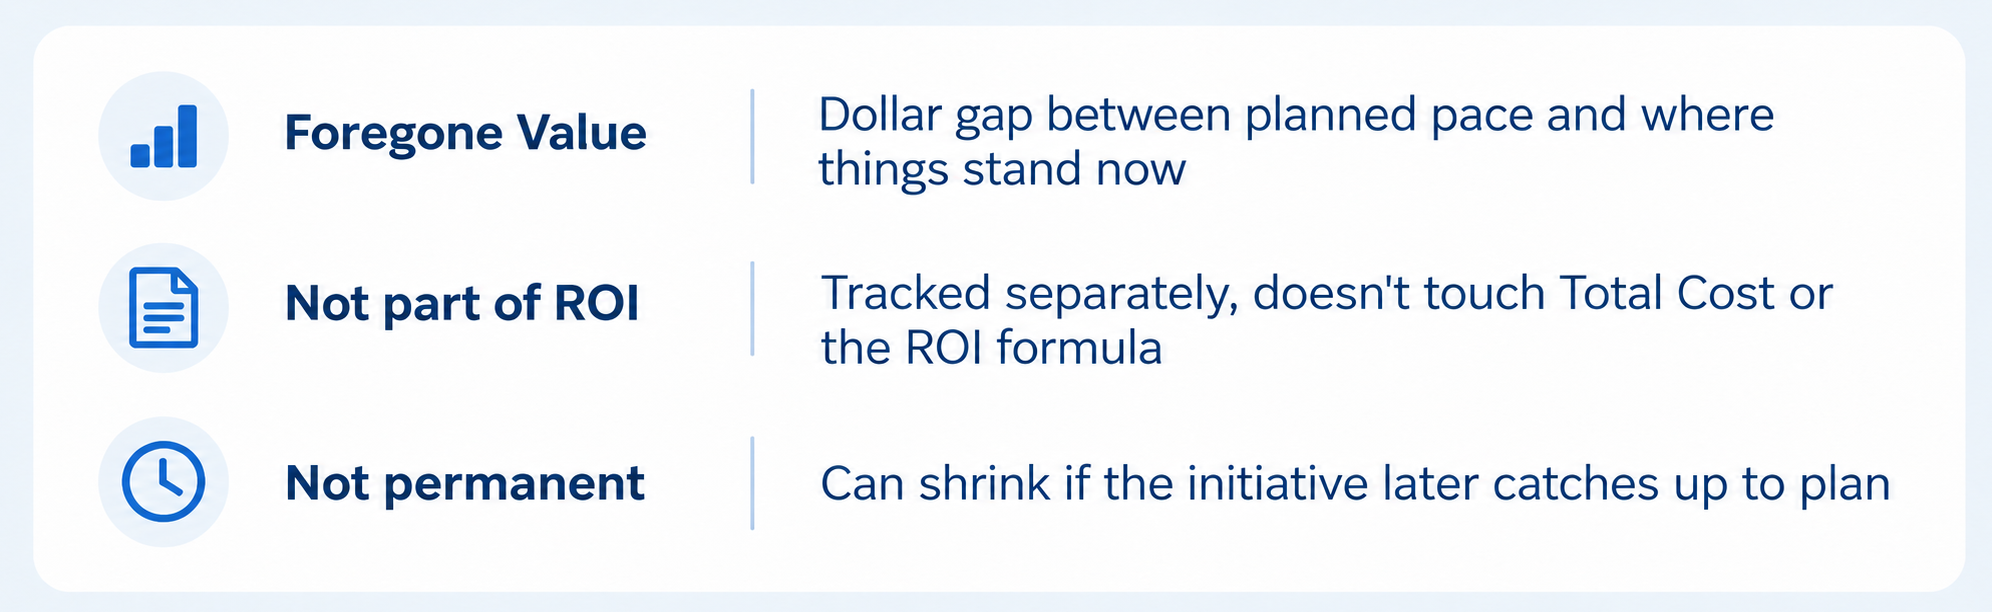
Every initiative has an implied pace: enough value earned by a given point to stay on track for its Goal by its deadline. Falling behind that pace means value that should already exist doesn't yet. That shortfall is Foregone Value, and it matters because delay isn't just a scheduling problem. It has a real cost, and until now, that cost had no number attached to it.
Foregone Value states the shortfall directly, in dollars, tied to a specific delay. At pace, there's nothing to report. Behind pace, the gap is calculated and shown as a figure a board can act on.
This is separate from I_ongoing, which is already inside the ROI formula, part of Total Cost. Foregone Value doesn't touch ROI at all. An initiative's ROI can still look healthy overall while real value quietly slips away behind schedule, and ROI alone won't show that. Foregone Value is what surfaces it, giving a leader a specific number to act on before the gap grows any further.
Figure 4: Foregone Value
What This Framework Can and Cannot Do
The table below lays out this framework's scope.
Table 1: Pros and Cons
|
What it can do |
What it cannot do |
|
Produces consistent ROI measurement across Revenue Generation, Cost Avoidance, and Process Improvement, with only the direction of Value Earned changing between them |
Measures initiatives whose value is enabling rather than direct, where the ROI is really the sum of everything built on top of it |
|
Isolates what an initiative is responsible for from what the market was doing anyway, through Business-as-usual |
Accounts for stakeholder change that's organizational rather than technical, which often takes longer than deploying the capability itself |
|
Ties measurement to a verified business outcome instead of a calendar date |
Measures outcomes that are risk reduction rather than value generation, without a probabilistic assumption a CFO can reasonably challenge |
|
Creates stakeholder alignment before the build begins, through the Baseline, Goal, and Approved Budget agreement |
Eliminates the judgment built into Business-as-usual itself, since the market trend it projects is a documented assumption, not a guarantee |
|
Makes the true cost of an initiative visible, separating one-time build cost from ongoing run cost |
Attributes value cleanly when more than one initiative moves the same metric at the same time |
|
Caps cost against a ceiling the board approved and surfaces remaining room in real time |
Captures the opportunity cost of people diverted from other projects to work on this one |
|
Turns delay into two dollar-denominated diagnostics: accumulated cost, and value not yet earned |
Assumes a realistic pace of value generation, since the straight-line plan can flag an early, expected slow start as a false shortfall |
|
Diagnoses which stage of the pipeline a delay sits in, through Time to Insight, Time to Action, and Time to Deployment |
Attributes value cleanly when more than one initiative moves the same metric at the same time |
|
Works for initiatives already underway, using a retrospective baseline and a forward-looking deadline |
Assumes a realistic pace of value generation, since the straight-line plan can flag an early, expected slow start as a false shortfall |
Together, the two columns are the boundary of what this framework claims: measurement that holds up inside them, and questions it can't answer outside them.
Setup Decisions
Accountability
Whoever builds a solution historically owns its value, and that's where measurement usually breaks down. A model, a system, an automation, whatever it is, can be technically sound and still produce nothing, because the business never acted on its output, or IT never deployed the change it recommended, or finance never validated the dollar figures behind it. When any one of those roles disengages silently, the initiative stalls and nobody can point to why, since no one was ever held responsible for that specific delay in the chain.
Figure 5: Accountability
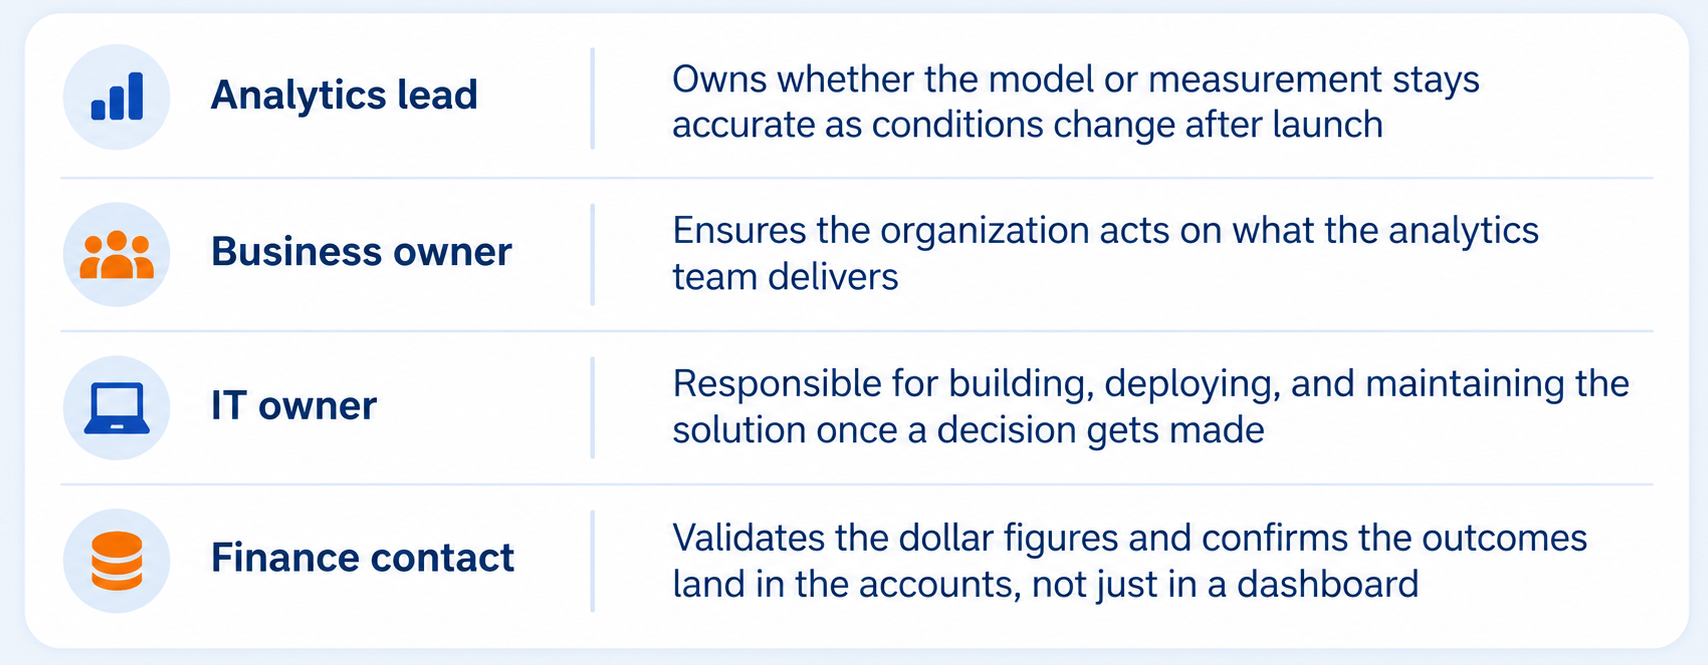
Four roles close that gap, named as people rather than departments, before the initiative begins:
Analytics lead owns whether the model or measurement stays accurate, including as conditions change after launch
Business owner ensures the organization acts on what the analytics team delivers
IT owner is responsible for building, deploying, and maintaining the solution once a decision gets made
Finance contact validates the dollar figures and confirms the outcomes land in the accounts, not just in a dashboard
A number with a name attached to it behaves differently than a number that just appears in a spreadsheet.
Tracking modes
Tracking mode is a choice made in Initiative Setup, the same place Baseline and Goal are entered, before deployment, independent of the initiative problem type. A Revenue Generation initiative, a Cost Avoidance initiative, and a Process Improvement initiative can each use either mode. What determines the choice is a single question, decided upfront: will the business check in at specific agreed points, or does it want a continuous view instead?
Figure 6: Tracking Modes
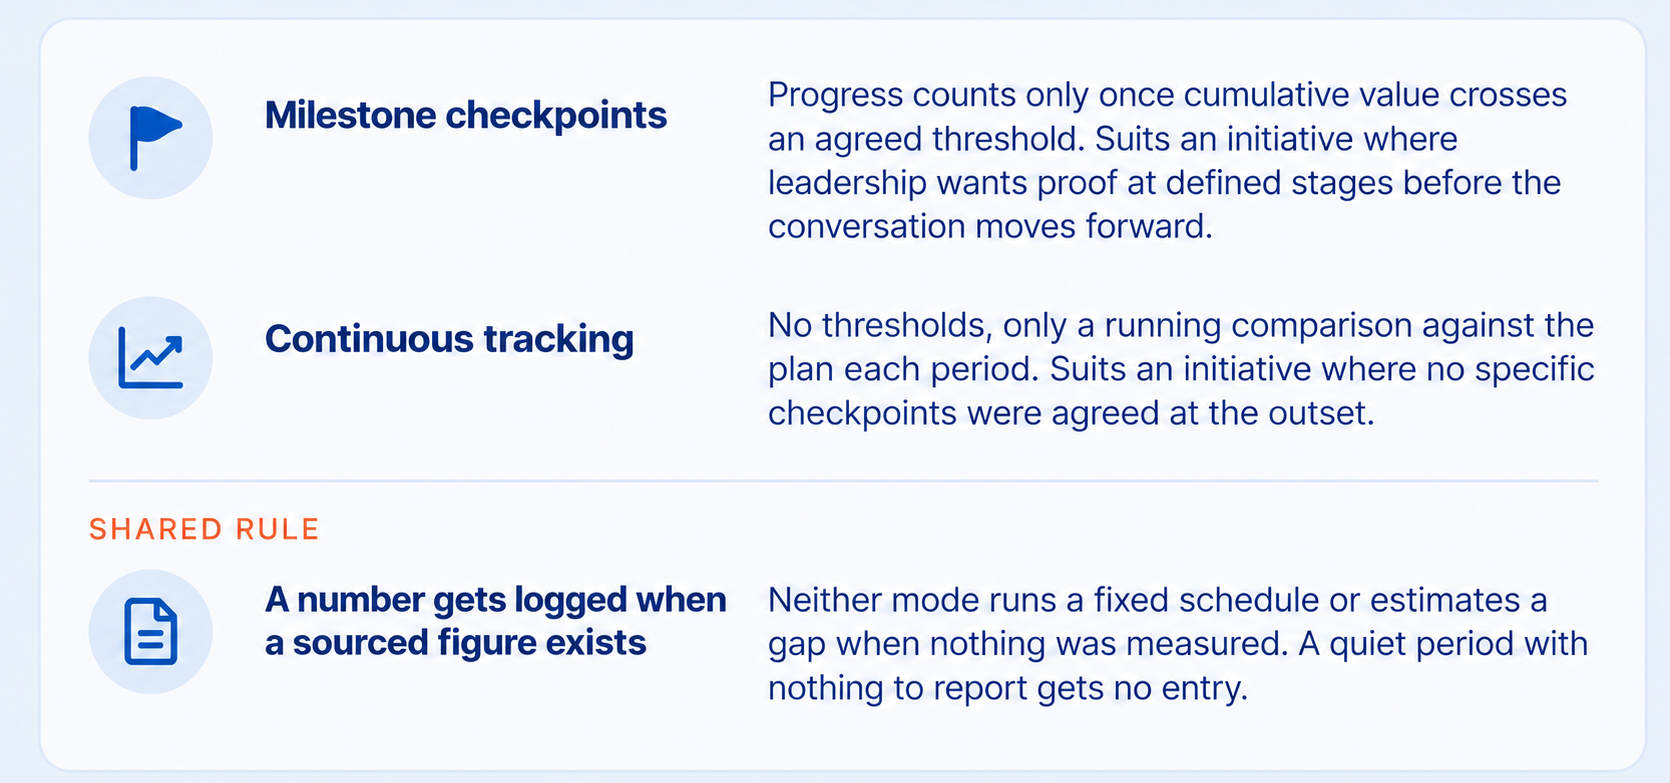
Milestone checkpoints suit an initiative where leadership wants proof at defined stages before the conversation moves forward. Say a fraud detection model is expected to reduce losses by 30% within a year. Leadership agrees, at the outset, to three checkpoints along the way, 10%, 20%, and 30% of that reduction, and treats each one as a decision moment, not just a date passing. Progress only counts once real cumulative value actually crosses one of those lines.
Continuous tracking suits an initiative where no specific checkpoints are agreed at the outset. Consider a regulatory reporting automation initiative, set up from the start to be measured this way. Leadership doesn't need to prove 25% before 50%. It wants to see, every reporting period, how much the initiative saves compared to the planned savings. There's no threshold to cross, only a running comparison against the plan.
Figure 7: Tracking Curve
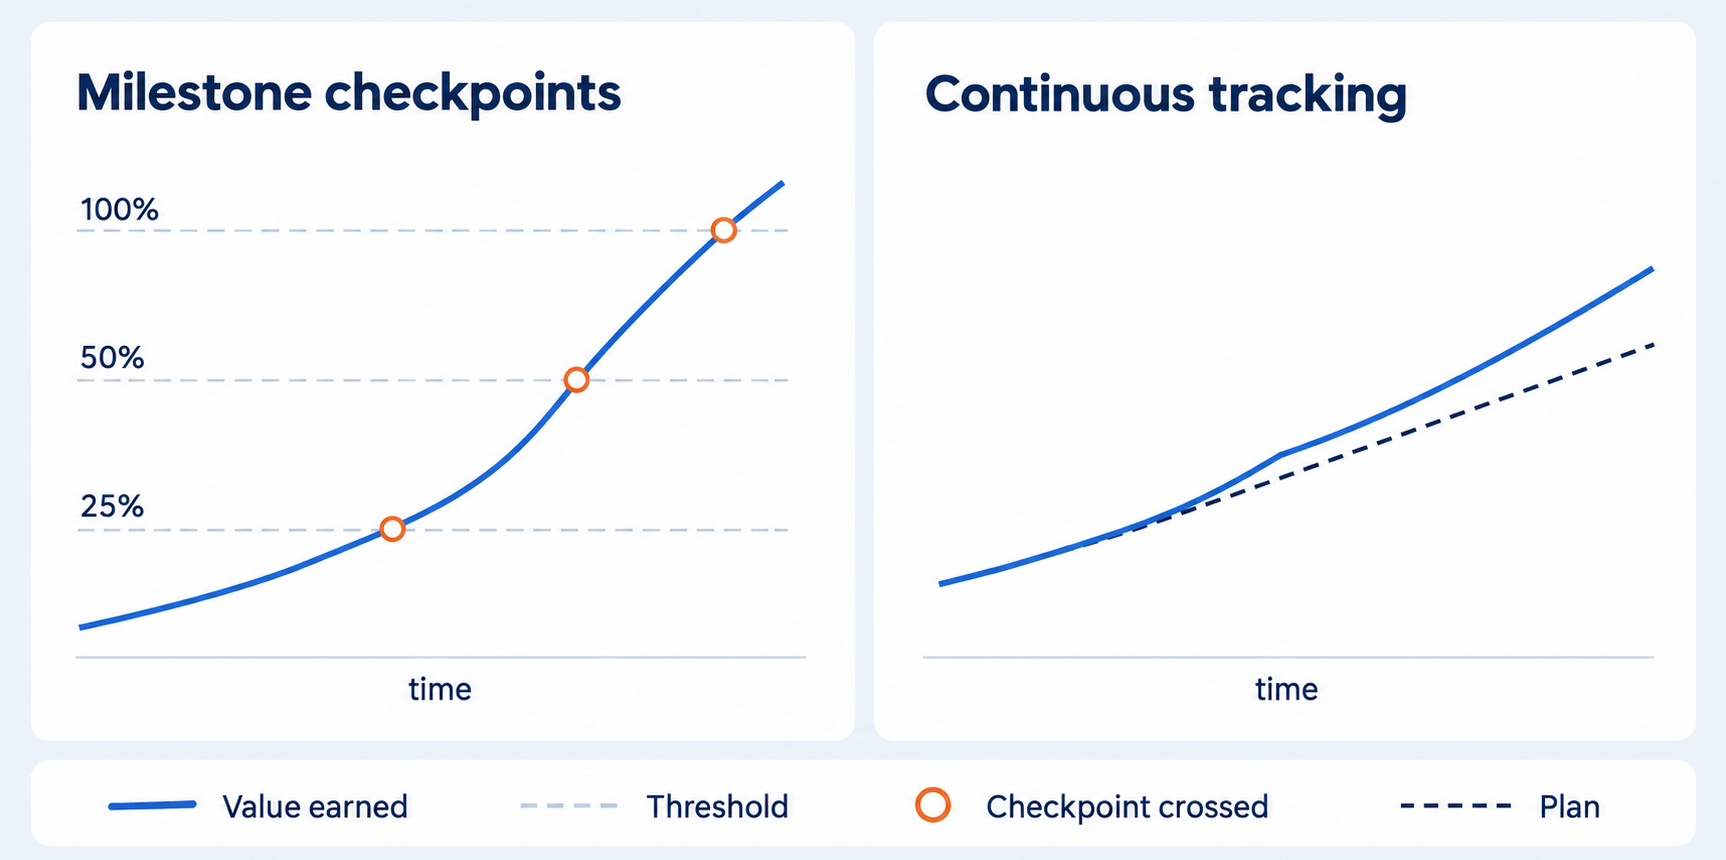
Neither mode changes the underlying formula. What changes is only how progress gets read: against defined checkpoints, or as a continuous line.
Both modes share one rule: a number gets logged when a sourced figure exists for that period. Neither runs a fixed schedule, and neither one estimates a gap when nothing was measured. A quiet month with nothing to report has no entry.
This matters more for continuous tracking than for milestones. A milestone-based initiative still has to prove it crossed a real threshold, so there's a natural check against a quiet month being papered over. A continuously tracked initiative has no such checkpoint forcing a number to appear, so this rule is the only thing stopping a slow month from being quietly smoothed into the average instead of showing up as the real gap it is
The Path to Deployment
Pre-Deployment
Every initiative spends time on approvals, checks, and building before it ever goes live. Our ROI framework logs pre-deployment time too. When a launch runs late, there's a specific stage to point to, not a vague sense that things took too long.
Before deployment, an initiative moves through a sequence: someone proposes it, the right people sign off, funds get released, the data gets checked, and the build happens. Initial Investment (I_initial) gets spent across the sequence: from the moment funds are released through the build itself. The framework logs each step as it happens, date-only, diagnostic rather than evaluative. Nobody commits months in advance to a date for board approval, so there's nothing to hold these dates against, only a record of how long each stage takes.
Figure 8 (1): Deployment Path
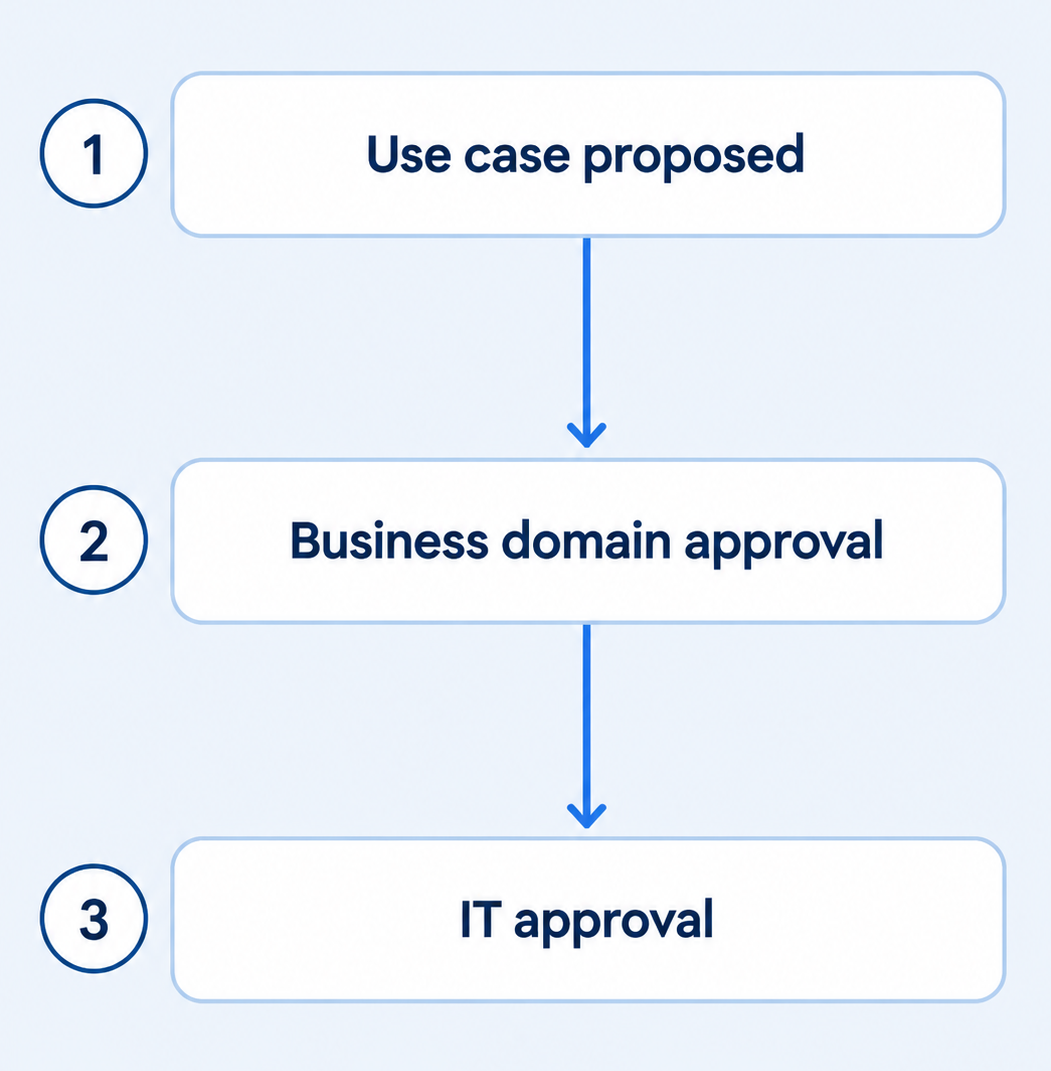
That record matters because delay doesn't start at deployment. A slow approval process or a data quality problem discovered late can add months before Ongoing Investment (I_ongoing) ever starts running. Without a log of when each pre-deployment step happened, those months disappear into a general sense that the initiative "took a while to get going," with no way to say which stage caused it.
The sequence starts with three steps, and each one answers a different question. Someone has to first make the case that this is worth doing at all, that's the use case proposal, usually written by whoever spotted the opportunity, often the analytics lead. From there, it goes to the business owner, who has to agree the problem is real and worth solving, and separately to IT, who has to confirm it's technically feasible to build. Only once both of those say yes does the sequence move toward funding. All three happen before any money moves.
Build
Once IT signs off, board approval releases funds. From step four through step eight, Initial Investment (I_initial) is spent, right up to the solution being ready, including external partners brought in for the build, as well as internal staff. For Next Best Offer Analytics, that figure came to $750,000 across the build.
Figure 8 (2): Deployment Path
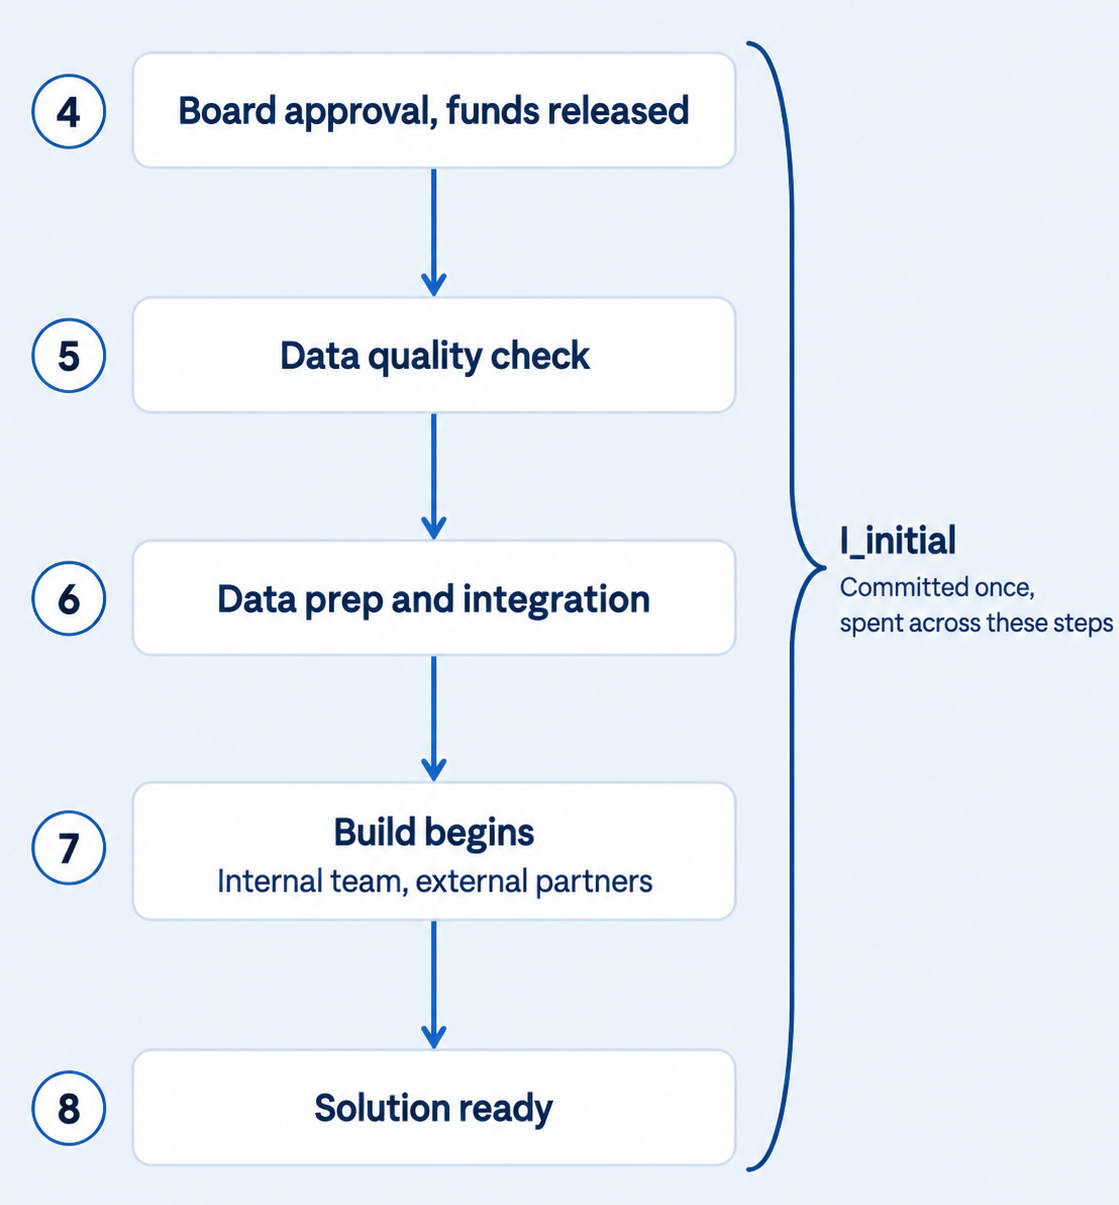
Initial Investment itself doesn't track this spending step by step. It's entered as one committed figure in Setup, not logged as it happens. Once the solution is ready, three steps remain before deployment, and this is where cost starts getting measured differently.
Deployment
Figure 8 (3): Deployment Path
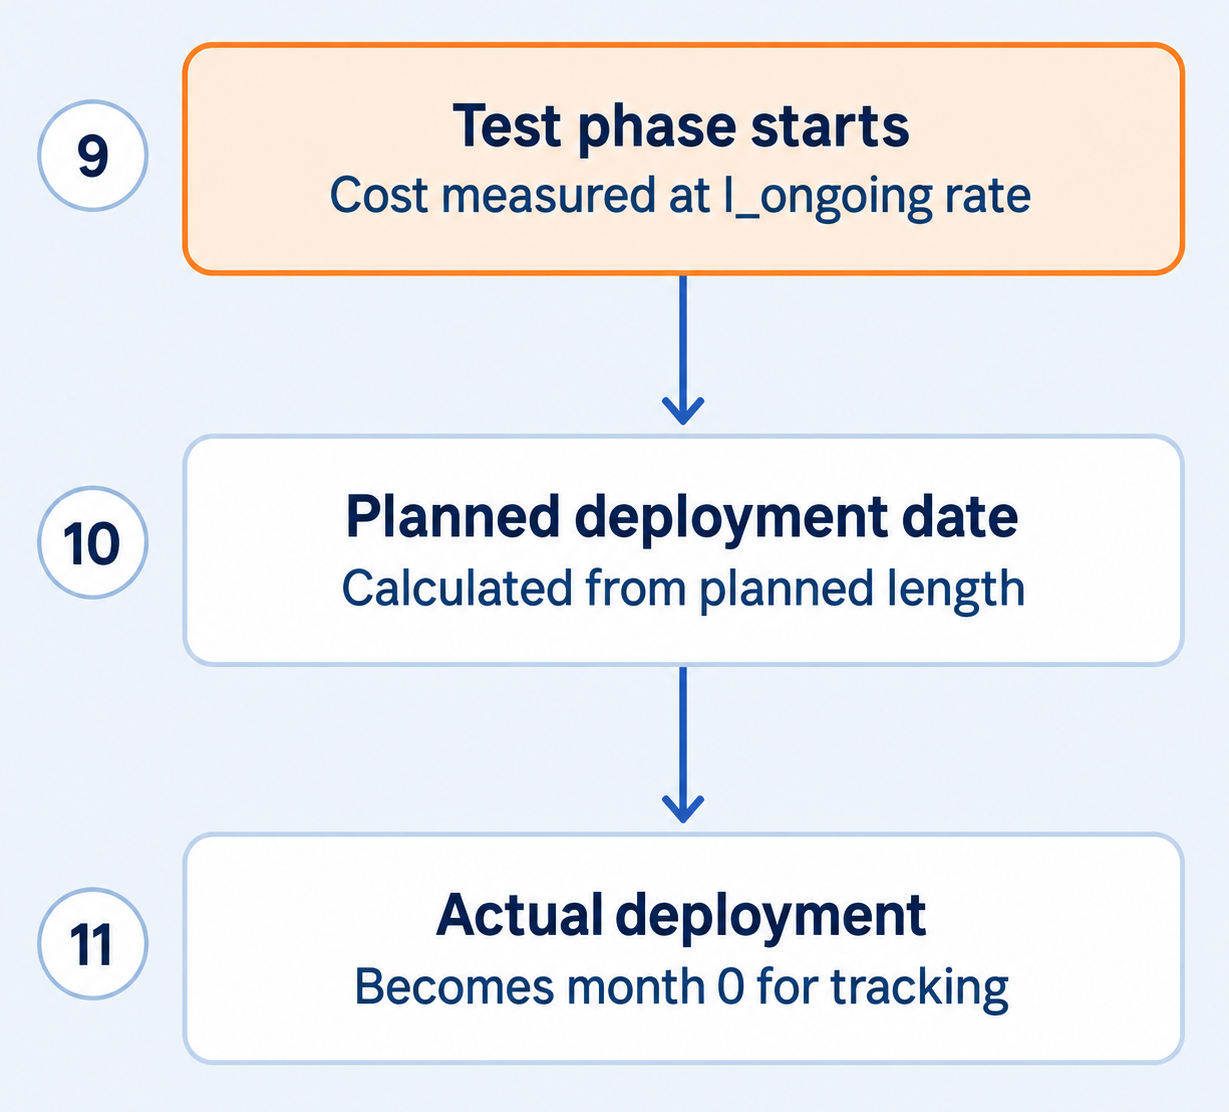
Step nine is the first point cost gets measured as a rate over elapsed time rather than a single committed figure, the same monthly rate Ongoing Investment (I_ongoing) uses after deployment, applied to however long the test phase actually runs. For Next Best Offer Analytics, that rate is $20,000 a month, and the test phase ran long enough to add $54,000 in cost before deployment even happened. A test phase that finishes early does the opposite, and shows a negative delay, not something to explain away, just the plan running better than expected.
This matters because it's the earliest point at which delay can cost something measured the same way ongoing delay will be measured for the rest of the initiative's life, not a one-off exception before the real tracking starts.
Taking This to Your Team
Setting an initiative up well takes a bit of upfront thought, a few people weighing in, and a shape that fits how the initiative runs. That investment pays off quickly. Once the setup is in place, the workbook takes over the heavy lifting, so the ongoing effort stays light.
Before reading part three of the series, this might be a good moment to bring it to your team. It is worth comparing against whatever frameworks you've tried before, what held up and what didn't. You can use this chance to look at how your organization already talks about things like Baseline, Goal, or ongoing cost. Lining up the terms tends to make the discussion easier. Also, consider pulling in whoever would eventually own a piece of this - the analytics lead, the business owner, IT, finance - sooner rather than later.
You can start with the blank workbook or view the filled workbook to explore Meridian Regional Bank’s ROI numbers.
Read Part Three in the series
Download >>> The filled Meridian workbook, walked through in full in Part Three
Download >>> The blank template, ready for your own initiative
Figure 9: ROI Framework
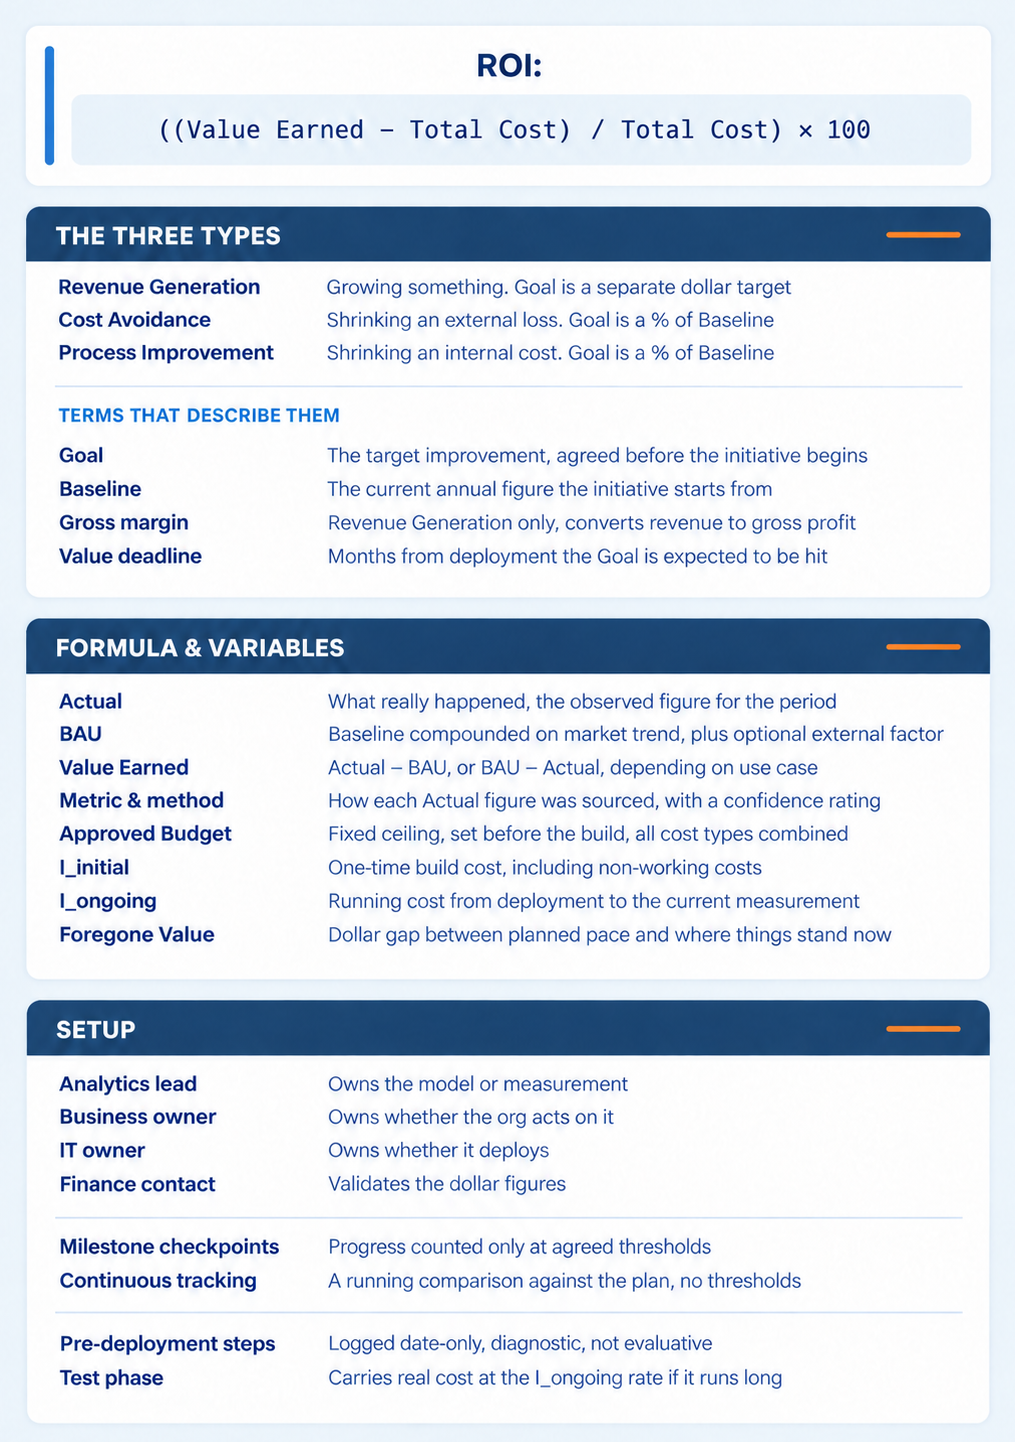
Key Takeaways
One formula runs underneath every initiative type. Problem type only decides which direction Value Earned runs: toward more revenue, or toward fewer losses.
Approved Budget is the ceiling Total Cost gets checked against, and Total Cost is what ROI actually divides by. Breach the ceiling, and the overrun is already inside the ROI number before anyone reports it separately.
Delay costs twice: I_ongoing keeps accruing the longer it runs, and Foregone Value tracks what should have been earned by now and hasn't. Different costs, worth watching separately.
A number only holds up if someone owns each part of it: who owns the model, who owns whether the business acts on it, who owns deployment, who validates the dollar figures.
New initiative or one already live, this framework works the same either way, the only difference is whether the history gets reconstructed or built as it happens.
References
[1] A. Kaushik and J. Nichols, "Calculate Return On Analytics Investment," Occam's Razor, Feb. 25, 2013. [Online]. Available: https://www.kaushik.net/avinash/calculate-return-on-analytics-investment/
[2] S. Tracy, "How To Measure the ROI of Data Analytics," Analythical. [Online]. Available: https://analythical.com/blog/measuring-analytics-impact
Drafted with AI assistance under the direction of Datalere's editorial team. Avinash Kaushik and Stephen Tracy are industry practitioners whose published work is cited and built upon, as credited in the Formula section; neither reviewed nor endorsed this article. The Meridian Regional Bank scenario is illustrative, not a real case study.
You Might Also Like



Talk To Us
Let's build your data strategy.
Tell us where your data is today, and we will show you the climb from here. Based in Denver, working with teams everywhere.